


Pakistan Oilfields Limi-ted (PSX: POL is a subsidiary of the Attock Oil Company Limited (AOC), and one of the largest E&P companies in the country. The E&P firm is involved in the exploration, drilling and production of crude oil and gas in the country and produces crude oil, natural gas, and LPG that it markets under its brand name POLGAS as well as its subsidiary, CAPGAS (Private) Limited. It is an associate company: Attock Refinery Limited (ATRL).
POL’s shareholding pattern

More than half of the company’s shareholding rests with the Attock Oil Company (AOC), which is the group. Attock Oil Company is vertically integrated oil Conglomerate Company. A category-wise breakup of the shareholding is shown in the illustration. Besides Attock Refinery Limited, POL’s other associate companies include National Refinery (NRL), Attock Petroleum Limited (APL), Attock Cement Limited, Attock Gen. Limited, and Attock Information Technology Services.
POL financial and operational performance
POL’s revenue growth in FY16 was constrained as the oil prices touched historic lows at that time, which also impacted the bottom line that fell by 14 percent, year-on-year. The E&P company’s volumetric growth was also affected by slowing down production by around 2-3 percent. However, lower exploration and prospecting expenditures partially offset the decline in profits.
FY17 turned out better as the oil prices recovered. POL’s revenues and earnings were up by 10 percent and 34 percent, year-on-year respectively after declining in the two previous years. However, the company’s production flows again dropped during the year. On the other hand, exploration costs remained under control.
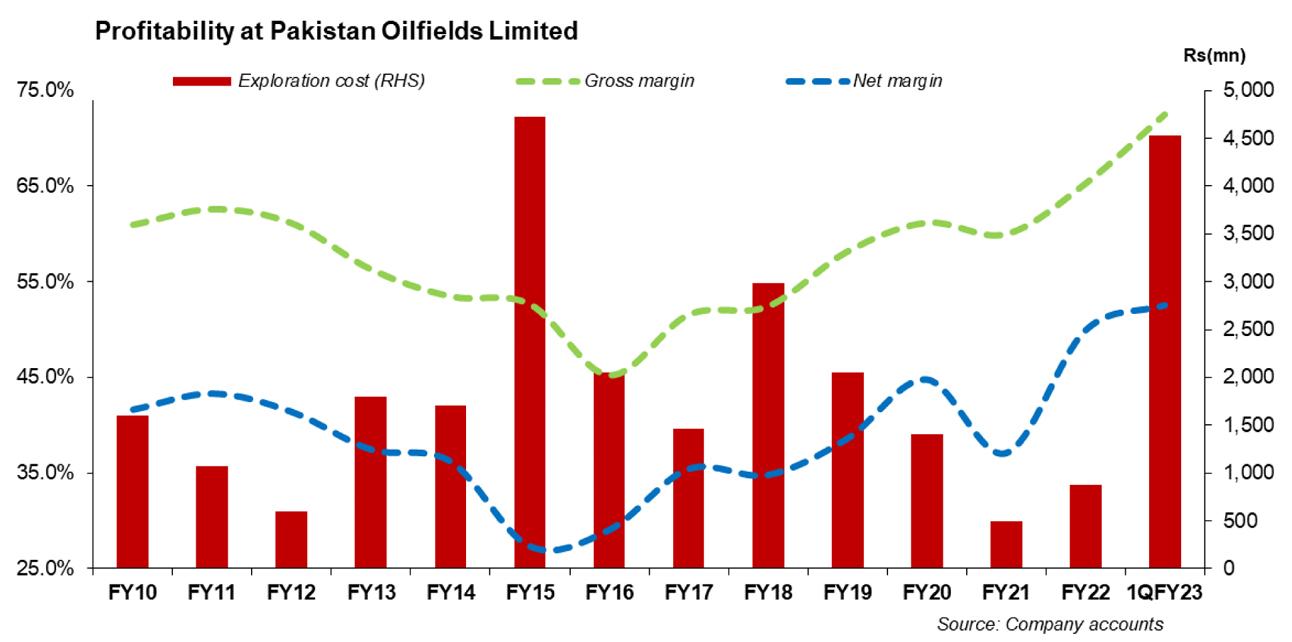
The company registered an improvement in FY18 as POL made new discoveries and new exploratory successes. Revenues climbed by over 19 percent, and earnings grew by 17.6 percent, year-on-year. Growth in revenues came from better crude oil prices as well as the highest crude oil production in the last decade. Exploration costs remained on the higher side due to higher operational activity, seismic data acquisition, and also dry and abandoned wells. The firm’s bottomline also benefitted with exchange gains due to depreciating currency.
FY19 was another year for higher oil prices and significant domestic currency devaluation also supported the earnings. POL’s topline grew by 25 percent, year-on-year, which came from around 14 percent year-on-year increase in international crude oil prices. However, volumetric sales remained tepid again especially that of crude oil with only slight increase in gas volumes. POL’s earnings for FY19 jumped by 48 percent, year-on-year; and apart from oil prices, lower exploration and prospecting costs and higher currency depreciation helped lift the company’s bottomline. The main factor behind lower exploration and prospecting was the absence of a dry well and also lower seismic acquisition.

FY20 was marked by the global pandemic as well as the crash in oil prices which were the key factors for slower growth in earnings of the oil and gas exploration and production sector. POL’s revenues came down by 13 percent, year-on-year, where the 4QFY20 saw a 48 percent decline in sales revenue – a period when the pandemic struck the country. The decline in revenue was due to falling volumetric sales as well as oil prices. During FY20, oil and gas production for POL plummeted by 13 and 9 percent year-on-year, respectively, while the average oil prices tumbled by 25-26 percent year-on-year. Exploration and prospecting expenditure remained lower in FY20 due to the absence of any dry well during the year. With lower interest rates during the year, other income and finance costs also decline for POL. POL’s earnings in FY20 were hence flat.
FY21 continued to show slow hydrocarbon production as well as weak international crude oil prices. Overall, POL’s revenues in FY21 were flattish, declining by one percent year-on-year. The company’s earnings were lower by around 18 percent year-on-year primarily due to exchange loss, lower income on bank deposits and higher taxation due to lesser exploration and development cost. During the year, production of crude oil and gas were lower by 0.77 percent and 2.5 percent year-on-year, respectively.

Pakistan Oilfields Limited posted a massive growth in earnings for FY22 of 94 percent year-on-year. The oil and gas company’s earnings growth came from higher topline. Revenues for POL increased by 44 percent year-on-year; on account of higher crude oil prices and currency depreciation. Crude oil prices were up by over 65 percent year-on-year in FY22, while currency depreciated by around 10 percent. However weak production statistics for oil and gas continued to impact in the topline growth. On the product front, both crude oil and natural gas flows witnessed a decline of 11 and 10 percent year-on-year, respectively in FY22. There was also a hefty growth in exploration and prospecting expenditure - rising by 77 percent year-on-year in Y22 due to increased seismic activity and hence increased geological cost. Finance costs posted a whopping increase of 20.4 times due to rising interest rates. However, the positive impact of higher currency depreciation was seen in seven times growth in other income due to exchange gains.
Pakistan Oilfields Limited in 1QFY23 and beyond
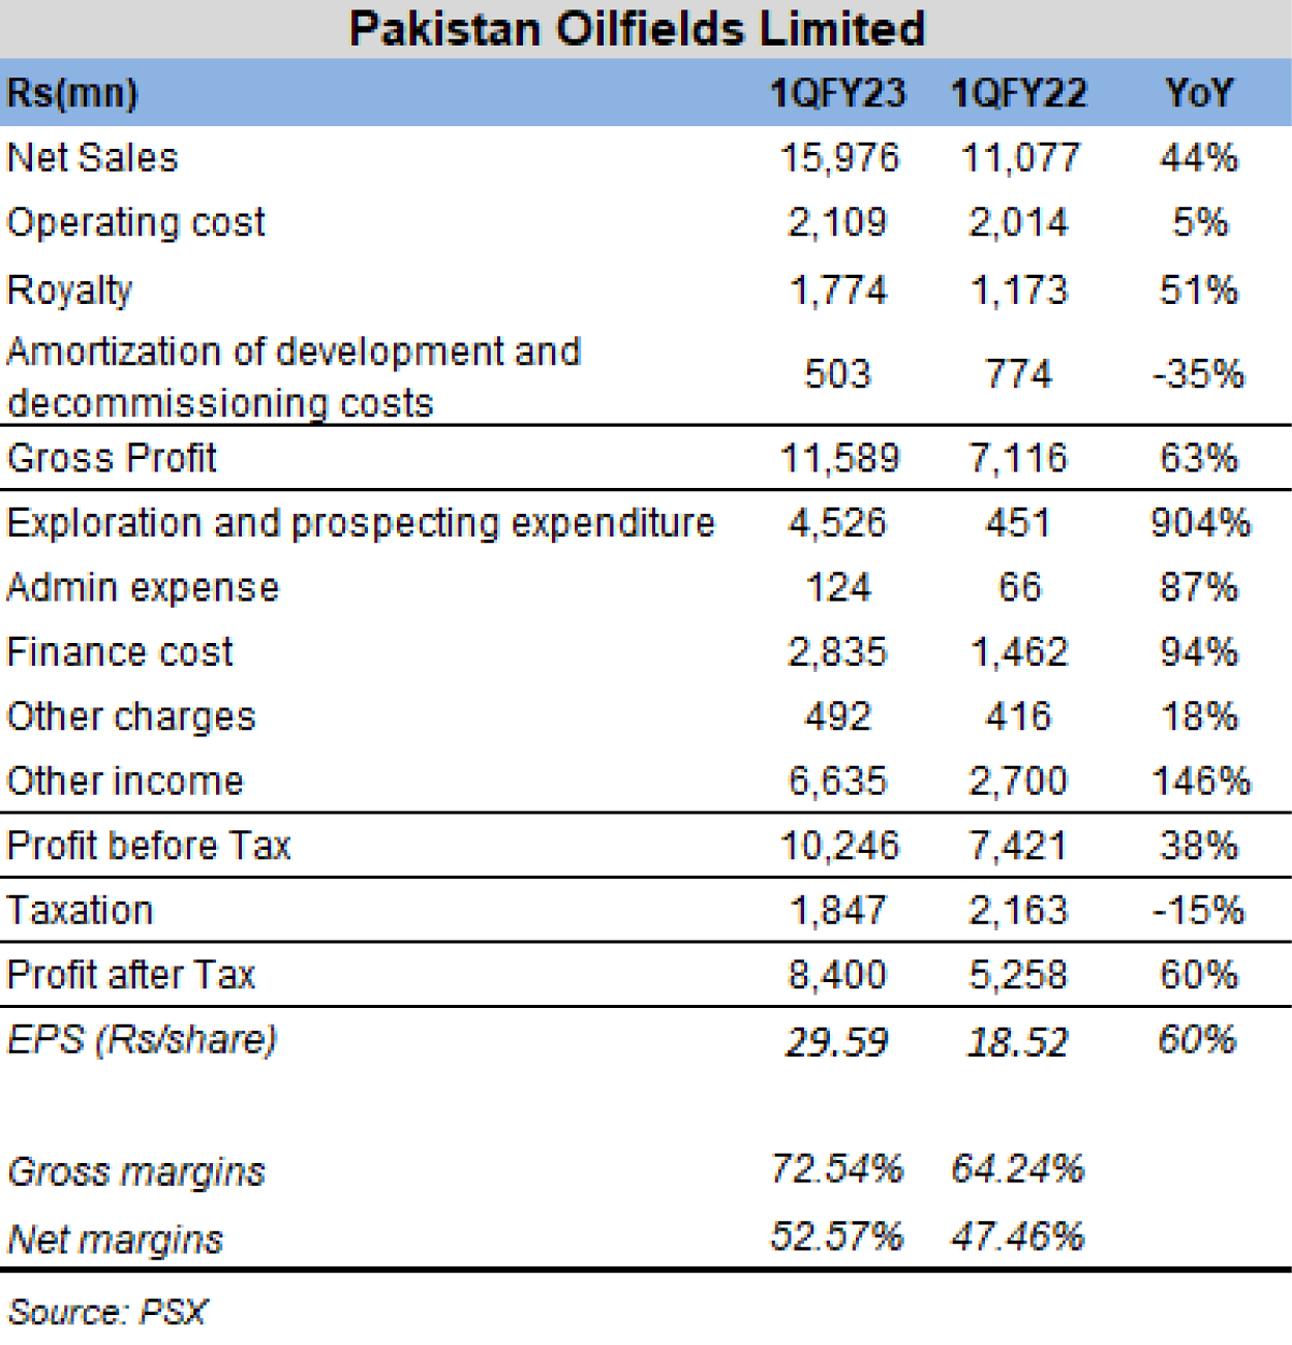
POL continued to benefit from falling currency during 1QFY23 with growth in earnings at 60 percent year-on-year. POL’s revenue growth was around 44 percent, year-on-year in 1QFY23 also due to higher crude oil prices and currency depreciation. The E&P company on the production front continued to see dip in oil and gas production, which stood at around 10 percent and 9 percent in 1QFY23.
POL’s exploration and prospecting expenditure increase massively by 10 times most likely due to dry well during the quarter versus none in similar period last year. Apart from the rise in topline, the growth in POL’s bottomline was also due to increase in other income coming from hefty exchange gains from currency depreciation. POL’s other income showcased a two times increase.
1QFY23 performance for the E&P sector was primarily driven by higher oil prices and currency depreciation – both indicators of volatility. Meanwhile, what is a key concern the E&P companies are the falling production levels of both oil and gas. Depleting reserves and small discoveries have been a highlight of the E&P production landscape for a long time with no respite being witnessed.


Comments
Comments are closed for this article.