


MCB is one of the pioneers of the banking sector of Pakistan. The bank was incorporated into the private sector in 1947, however, in 1974, it was nationalized. The bank was later privatized in 1991. MCB is the first Pakistani bank that got its global deposit receipts (GDRs) listed on London Stock Exchange in 2006. It is also the first Pakistani bank to incorporate a wholly-owned Islamic subsidiary.
The bank enjoys a huge geographical reach with over 1600 branches and over 1400 ATMs across Pakistan with a customer base of over 8 million. This is coupled with a significant footprint in UAE, Bahrain, and Srilanka. This makes MCB the 2nd largest bank in Pakistan after HBL in terms of the branch network. In terms of assets, MCB holds the 4th slot in the banking sector.
As per the economic data released by SBP, MCB holds a market share of 6.41 percent in terms of Deposits and 5.98 percent in terms of Advances as of December 2021. The bank has a market capitalization of 13.03 percent as of December 2021.
Pattern of Shareholding

As of December 2021, MCB has a total outstanding share capital of 1.2 billion shares which are held by 56294 shareholders. The major shareholder of the bank is Associated Companies, Undertakings, and Related Parties holding 19 percent of the shares. Among the Associated Companies, Nishat Mills Limited and Adamjee Insurance Company Limited enjoy the major chunk. This is followed by Maybank International Trust holding 18.78 percent of the outstanding capital. The local General Public have a share of 12.88 percent followed by the Directors, Chief Executives, their spouses, and minor children holding 10.33 percent of MCB’s shareholding. Last but not the least, come to the Insurance Companies enjoying 9.62 percent of the MCB’s outstanding capital. Other shareholders include Banks, DFIs and NBFIs, Modarbas and Mutual Funds, NIT and ICP, Foreign Public, etc.
Performance over the years (2017-2021)
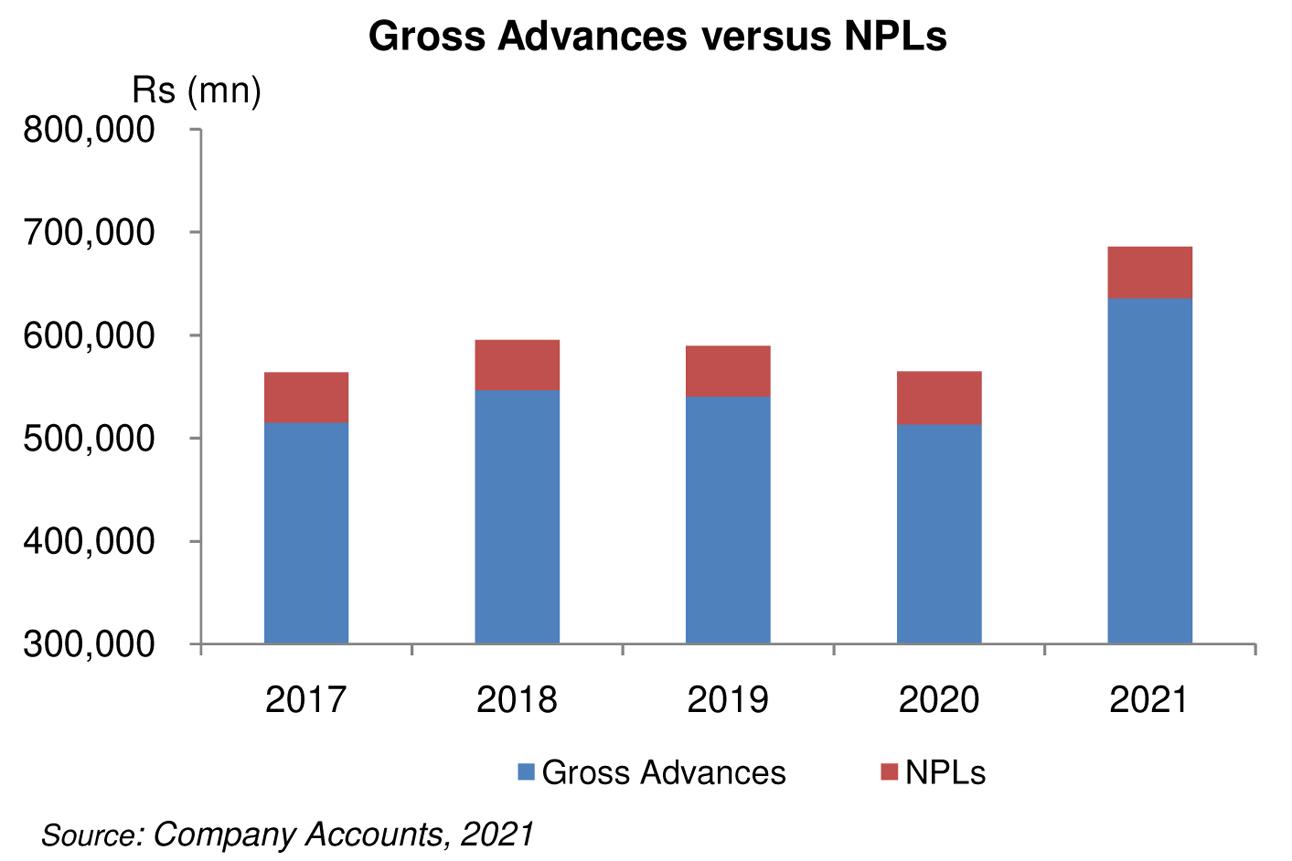
MCB’s top line has been expanding from CY17 to CY19 and then started declining since CY20. In CY20, the topline showed a slight downtick mainly on the heels of markup earned from loans and advances. Gross advances dropped by 5 percent year-on-year in CY20. This was the time when Covid-19 hit Pakistan, the businesses were shut down and there was a low appetite both on the consumer and corporate front. Moreover, the decline in yield owing to a significant drop of 625 bps in the discount rate also played its part and kept income on advances in check. MCB’s ADR also considerably dropped from 47 percent in CY19 to 40 percent in CY20. The Non-performing loans also grew by 4 percent year-on-year in CY20 owing to the widespread economic slowdown.

Markup expense also showed a drop in CY20 despite the growth in deposits due to a downtick in the discount rate. Moreover, CASA also improved in CY20 to clock in at 93 percent versus 90 percent in CY20. This translated into an impressive 52 percent in the NIM.
In CY21, the top line remained under pressure despite growth in advances and investment. This owes to a decline of 166 bps in the discount rate during the year. Hence, Net Interest Income shrunk by 10 percent year-on-year.
Non-markup income of MCB had been on a downward journey from CY17 to CY19, however, it recovered afterward. Though, it is to be noted that the contribution of non-markup income in the total income had been on a constant decline since CY17. It only improved in CY21 to clock in at 24 percent of the total income from 20 percent in CY19. The major role was played by foreign exchange income followed by fee & commission income, dividend income, and derivatives income.
With shrinking margins across the industry, MCB has been religiously focusing on diversifying its income. Improved transactional volumes, enrichment of the bank’s product suite, and technological up gradation have enabled it to reflect a year-on-year growth of 11 percent in its non-markup income in CY21.
Another factor that keeps the bottom line upbeat over the years is how efficiently the bank manages its operating expense despite constant inflationary pressure, currency devaluation, rise in commodity prices, high regulatory charges, and the persistent increase in the branch network. Since CY17, operating expenses have only grown by 28 percent. Hence, EPS growth has seen no breather since CY18.

MCB’s advances have been dropping of late, but, it recovered in CY21 with an ADR of 45 percent versus 39.83 percent in the previous year. However, with an IDR of 73 percent in CY21, investments still lead the show. Despite a downtick in advances, NPLs have been on the rise since CY18 only to show a breather in CY21. As a result, the infection ratio also improved in CY21 to clock in at 7.94 percent versus 9.97 percent in CY22.
It is presumed that with higher taxation imposed on the banks having low ADR, MCB has to soon rethink conservative asset composition and focus on its advanced portfolio to evade higher taxation.
Performance 9MCY22
MCB boasted a tremendous year-on-year growth of 58 percent in its top line during 9MCY22. While Advances showed a downtick during the period, investments portrayed a meager 7 percent year-on-year growth. However, the high-interest rate backdrop played its role in keeping the topline in pink. Though, the year-on-year deposit growth of 13 percent in 9MCY22 translated into an 88 percent year-on-year growth in the markup expense shrinking fund-based income growth of 31 percent for the period. It should be noted that while the bank enjoys an industry-leading CASA of 93.73 percent, savings accounts constitute the major portion while CA deposits stand at 39 percent despite a year-on-year growth of 19 percent during 9MCY22. With the requirement of a Minimum Deposit Rate (MDR) on saving accounts slapped on the banks, saving accounts are the Achilles heel for MCB.
Non-fund-based income also proved to be the major growth propeller during 9MCY22 with growth mainly coming on the heels of foreign exchange income amidst the constant devaluation of the Pak Rupee. Other contributors to the growth in non-fund-based income were debit cards, home remittances, and trade businesses.
As the bank continues to invest in its branch network, human resources, and technology gradation, the operating expense of MCB grew by 17 percent year-on-year in 9MCY22. High inflation and constant currency devaluation also played a part in pushing up the operating expense. However, with the strong build-up in core earnings and non-markup income, the cost-to-income ratio significantly improved during the period.
Non-performing loans slightly grew by 4 percent year-on-year, taking the infection ratio to 7.8 percent vis-à-vis 7.4 percent as of December 2021. However, the bank was able to undertake a net provision reversal which helped its profit before taxation to grow. MCB coverage ratio clocks in at 81 percent as of September 2022.
Retrospective effect of tax changes along with higher taxation imposed in the Finance Act, 2022 culminated in an average tax rate of 62 percent during 9MCY22 vis-a-vis 41 percent during the same period last year. Consequently, Profit after tax and EPS declined by 10 percent year-on-year.
Future Outlook
With the low contribution of current account deposits in its CASA mix, MCB has been a victim of high markup expense and shrinking spreads amidst MDR requirements. This coupled with low ADR and the related taxation has taken its toll on the bottom line of MCB during 9MCY22. In order to avoid things worsening in the future year where anticipated windfall taxation is sure to eat up a significant portion of the banking sector’s income, MCB has to focus on low-cost deposit mobilization to control its markup expense. Moreover, MCB has to increase its ADR to evade higher taxation on government securities. With low borrowing appetite across the customer segments and high risk of non-repayment owing to the economic slowdown, lack of power supply as well as high inflation and interest rate, how MCB will revamp its balance sheet and attain a positive Profit after tax will be the real feat to witness in CY23.


Comments
Comments are closed for this article.