Indus Dyeing and Manufacturing Co. Limited


Indus Dyeing and Manufacturing Co. Limited (PSX: IDYM) was set up as a public limited company in 1957 under the Companies Act, 1913. The company essentially manufactures and sells yarn.
Shareholding pattern

As at June 30, 2021, close to 73 percent shares were owned by the company’s directors, CEO, their spouses and minor children. Within this category, majority are held by Mr. Kashif Riaz, a director on the board. About 19 percent shares are held under the category of ‘individuals’, followed by 3 percent in financial institutions. The remaining shares, about 5 percent, are with the rest of the shareholder categories.
Historical operational performance
Indus Dyeing and Manufacturing has largely seen a growing topline, with the exception of FY16 when it contracted by nearly 11 percent. Profit margins, on the other hand, have grown and reached a peak in FY19, after which they fell in FY20, and rose again in FY21.
In FY17, topline posted a 9 percent growth, crossing Rs 19 billion in value terms. This was attributed to a rise in yarn prices. Increase in sales of Home Textiles, particularly in the overseas market also contributed to better revenue. Production cost, on the other hand, although lower at 91.3 percent of revenue, was still above the 90 percent mark. As a result, gross margin improved to 8.7 percent for the year. Moreover, the decreases in administrative and distribution expenses, coupled with a rise in other income also contributed to better profitability for the year. The former can be attributed to a decrease in cotton prices and fuel expenses, while the latter is due to profit on trading of raw cotton and capital gain on sale of investments. Thus, net margin for the year grew to 3.47 percent, up from less than 1 percent in FY16.

Revenue in FY18 was higher by 11.8 percent, crossing Rs 22 billion in value terms. This was again attributed to an increase in yarn prices; a breakdown of sales reveals that revenue from local yarn sales had decreased, while export sales had increased, by 21.6 percent. Production cost fell below 90 percent of revenue, at 89 percent, allowing gross margin to improve to 10.6 percent. Other income increased remarkably as a percentage of revenue, from Rs 49 million in FY17, to Rs 287 million in FY18. This was sourced from duty drawback and unrealized gain on revaluation of foreign currency debtors. This, together with a higher topline, largely offset the increase in other expenses and finance expenses. Thus, the net margin also improved to 6.24 percent.

The company witnessed the highest growth in revenue thus far, at 12.8 percent, in FY19. This was to some extent attributed to the currency devaluation. However, it was the local yarn sales that actually saw an increase, by almost 50 percent. Production cost was down only marginally as currency devaluation made imported raw material expensive, along with high interest rates. The latter is also reflected in finance expenses making a larger share in revenue, almost 2 percent. Therefore, the gross margin was also slightly higher at 10.8 percent. Other income, again, was significantly high, at Rs 644 million. This was derived from duty drawback and unrealized gain on revaluation of foreign currency debtors. Thus, the net margin was recorded at 6.9 percent for the year, with bottomline at over Rs 1.7 billion- the highest seen thus far.

The growth rate in revenue in FY20 was relatively subdued, at 8.7 percent, compared to the double-digit growth seen in the last two years. This was due to the business, production, and sales affected in the last quarter of FY20 due to the Covid-19 pandemic. Production loss stood at 43 percent in the last four months while export dispatches were lower by 39 percent; although, in value terms, export sales were higher by 26 percent. The cost of production increased to 91.7 percent of revenue, reducing the gross margin to 8.3 percent; combined with this was the loss in other income, which stood at Rs 196 million, significantly lower than that seen in the last two years. Thus, the net margin was also reduced to 3.5 percent.
Recent results and future outlook
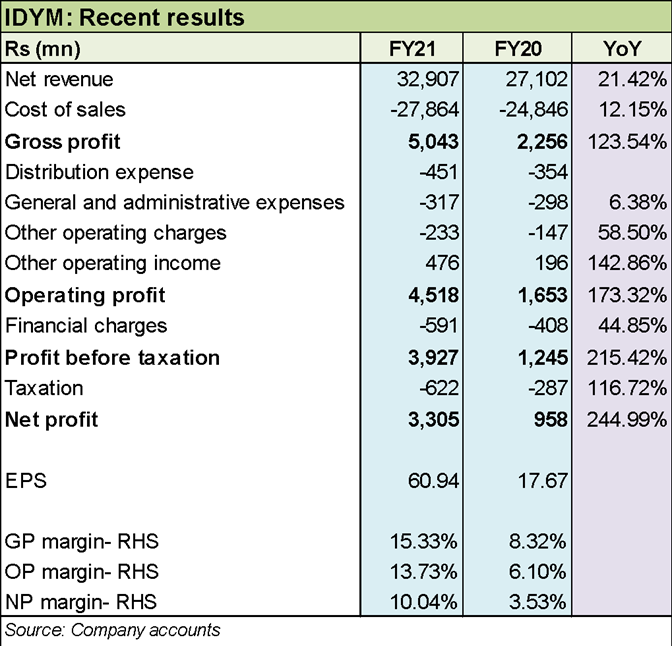
Revenue in FY21 was higher by 21.4 percent and stood at almost Rs 33 billion for the year. This was a result of demand recovery as businesses and economic activities began to resume a few months after Covid-19 was declared a pandemic. Most of the sales were concentrated in the second half of the year. Export sales exhibited a growth of 24.8 percent, while local sales were higher by 23.4 percent. Production cost went down considerably, to 84.7 percent, allowing gross margin to reach over 15 percent, which was the highest seen since FY14. Despite the rise in finance expense and taxation, other income (FY21: Rs 477 million), coupled with higher revenue and lower costs, took the net margin to 10 percent. In value terms, net profit reached a peak at Rs 3.3 billion.
Although the textile sector is a huge contributor to the country’s total exports, it often faces severe competition in the global arena, where Bangladesh and India gain precedence due to lower costs. Given the disturbances in these countries, Pakistan was able to garner higher orders. But production costs continue to remain high, which does not allow for competitive pricing and/or profitability.


Comments
Comments are closed.