

Making sense of 2.7 million entries of individual tax filers published by the FBR is no easy task. As it turns out, much depends on what is not reported by the FBR than on what one can glean from these entries recently published for the fiscal year 2018.
Over the five years of PML-N regime, the number of tax filers more than doubled from less than a million to more than two and half million, where FY18 saw highest growth of 59 percent. On the whole, this has been largely made possible by growth in filers who filed a return of ‘zero’ rupees; about a third of increase in filers between FY13 and FY18 came from zero-return filers, largely due to huge growth of zero-filers in FY17. However, in FY18 the situation was better. In FY17 about 47 percent of the increase in filers stemmed from zero-return filers; in FY18 that number was down to 34 percent.
Total tax collection from individual filers also grew substantially on absolute basis; from nearly Rs90 billion in FY13 to about Rs320 billion in FY18. That’s faster pace than growth in overall direct tax collection which grew from Rs743 billion to Rs1536 billion between FY13 and FY18. As percentage of total direct tax collection, taxes paid with return filed by individuals rose to 21 percent by FY18 from 12 percent in FY12. Whether this implies that businesses didn’t pay their due share over this period or whether individual filers decided to come clean with their revenue books, is something that requires further research, the data for which isn’t publicly available.
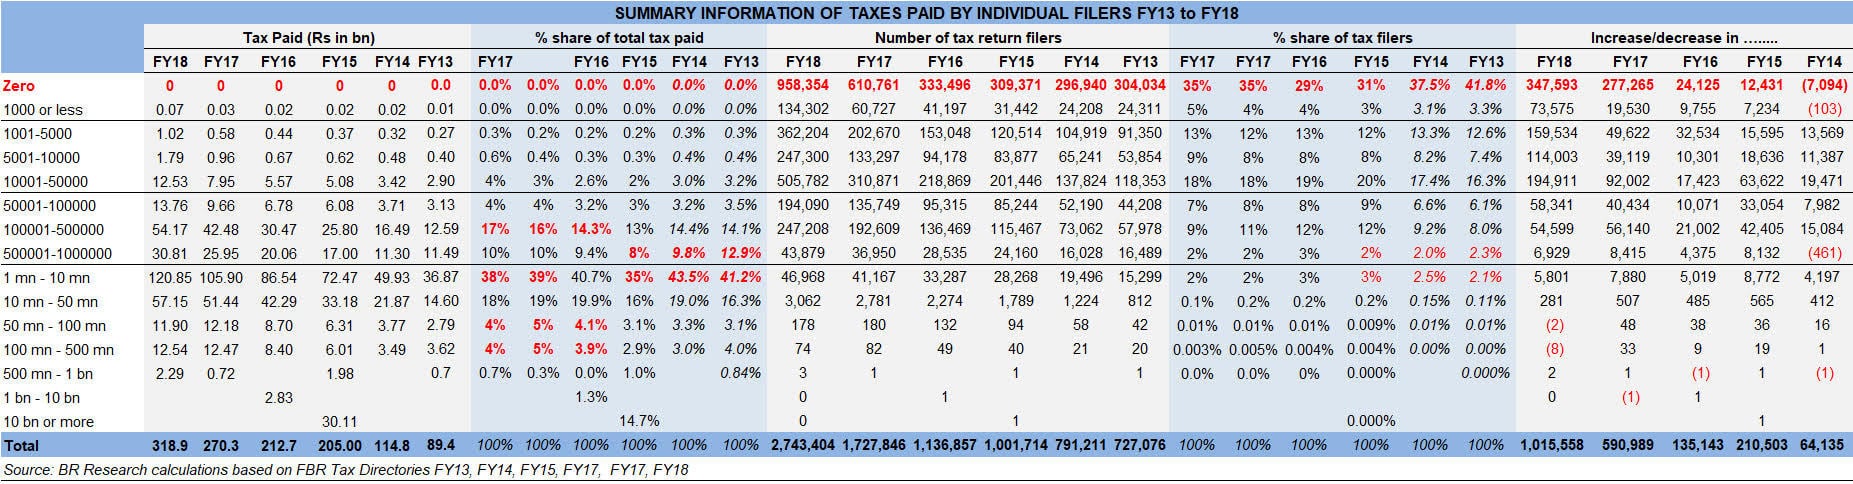
Yet some things haven’t changed. For instance, if 0.12 percent of individual filers paid about 24.3 percent of total taxes paid by individuals in FY13, then the same percentage of filers paid about 26.3 percent in FY18. Or the fact that the biggest contribution to growth in taxes paid by these filers mainly comes from high income earners, who paid between Rs1-10 million as taxes in their returns.
But all this data is without the necessary context that FBR doesn’t provide. For instance, do zero return filers remain as zero return filers in the ensuing years or they eventually transition to higher brackets. Or the extent to which these individual filers come from salaried class, whether they are self employed individuals? Which economic activities (industries) do these individuals belong to as per ISIC classification? Or what is the region wise collection of individual filers? These and many more questions can be answered if the FBR shares its data in a manner that is meaningful for policy analysis and helps towards a healthy debate on taxation affairs. Afterall, as former FBR boss Shabbar Zaidi oft says, transparency is critical to help bring taxation reforms in the country.


Comments
Comments are closed.