


Pakistan’s palm oil imports shot up to 341,000 tons in July 2020, the highest monthly number since at least CY15 if not highest ever, according to advance data release by Pakistan Bureau Statistics (PBS). The year-on-year growth in July 2020 stands at a whopping 164 percent. What explains this growth?
It turns out there are two theories. One, that the PBS had managed to goof up the numbers. This may not be entirely incorrect. In comparison to PBS’s monthly palm oil import numbers reported in its advance data release, shipment data compiled by the edible oil industry association are hardly ever in sync. That’s rather strange since PBS also uses shipment data, which it gets from customs via the FBR.
In strict sense, the industry classifies ‘crude palm oil; RBD palm oil; and Palm Olein’ as palm oil imports. But even if one adds import data of other palm oil-based products (such as palm stearin used for soapmaking) to the equation, it doesn’t reconcile with the ‘palm oil’ imports reported by the PBS on monthly basis. Then again, nor does the data compiled by the industry reconcile with the final HS-code wise numbers released by the PBS. Ergo, the surge in July’s palm oil imports may well be a data glitch, or the industry hasn’t tallied all transactions.
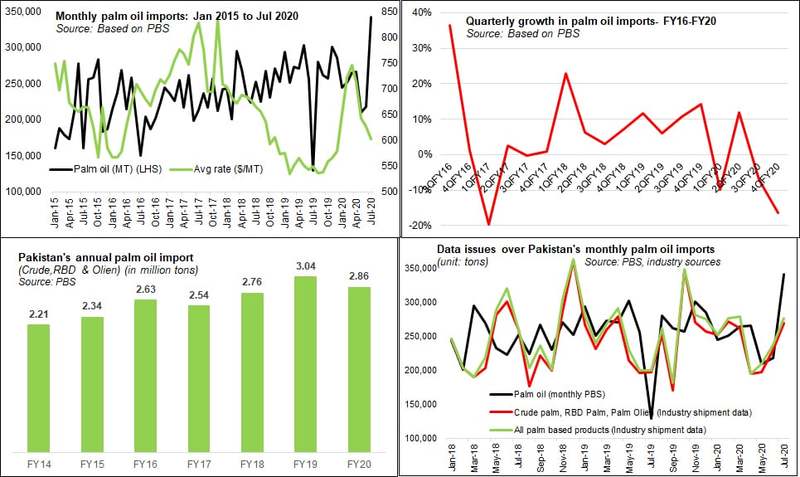
The second theory is based on market fundamentals. If PBS data is any guide, average palm oil prices tanked about 19 percent between March and July 2020. That was largely because of the pandemic affect that led to lockdown and reduced consumption across the world, including Pakistan. This is quite visible in Pakistan’s annual and quarterly import trends for palm oil (crude palm; RBD; & palm olein).
As a result, industry sources say, palm oil stock in the pipeline was offered at discount by both Malaysia and Indonesia, whereas forward contracts were pricier. Aiming to take advantage of lower prices, local edible oil industry booked big shipments that landed in July leading to higher than usual monthly palm oil imports.
If this theory is correct, then monthly import numbers should normalise in the months ahead, and in fact should average less than 250,000 tons in the remaining months of FY21 to equal annual imports of roughly 3 million tons. If not, then data inconsistencies may well be worth looking at.


Comments
Comments are closed for this article.