Exports: Readymade garments take a dip


There is not much you can read from a 2 percent year-on-year growth in exports. The 7MFY20 export numbers are a continuation of the trend that started with FY20. Don’t pin your hopes on miraculously achieving the export target this year. Keep hearing the “quality of exports” story from the government? Don’t blame them. The export story has indeed been about higher volumes. But how high can the volumes go is the next big question.
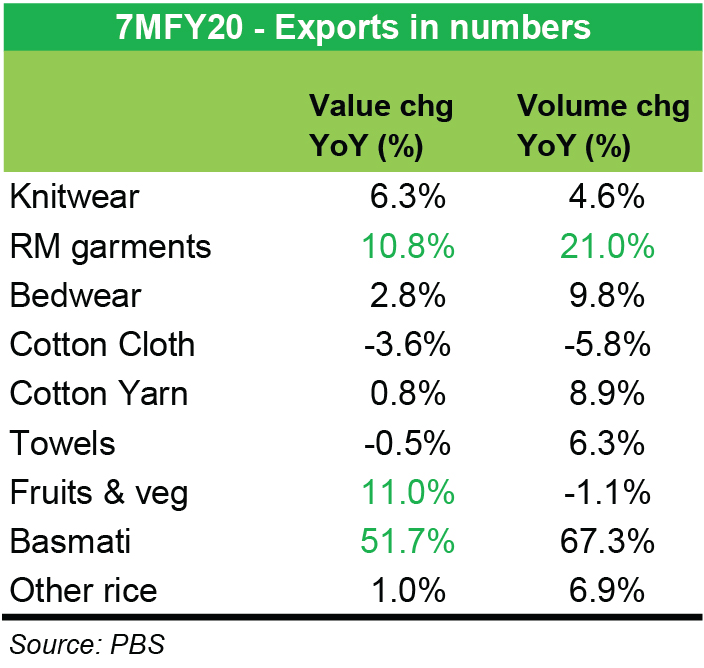
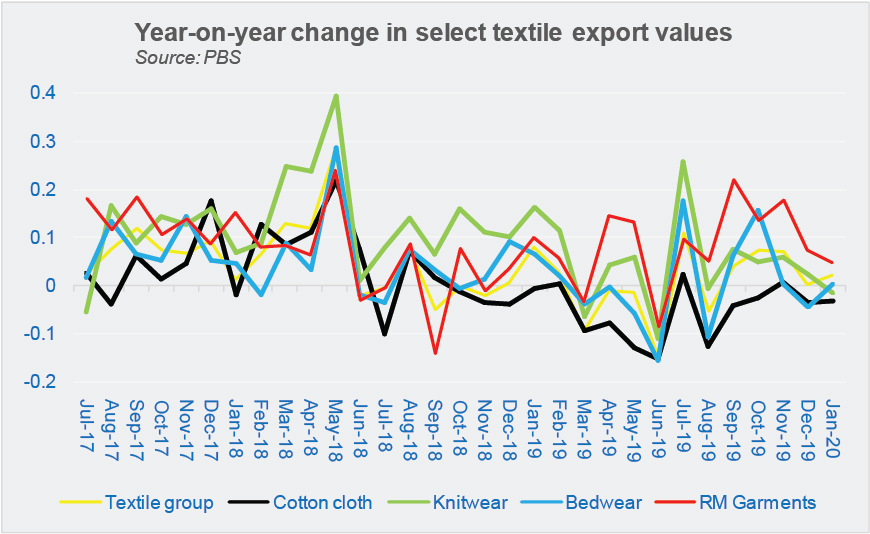
The major shift within textile export composition came in readymade garments – the volumes of which rose by an average 31 percent year-on-year, for 15 straight months starting October 2018. A 15 percent year-on-year increase in readymade garment exports was the lowest such increase during the period. January 2020 saw readymade garment volume drop by 15 percent year-on-year.

Readymade garments volume of 4171 thousand dozen is a 14-month low. This could well be an aberration, but a cursory look at monthly year-on-year changes shows the volumetric growth may well have peaked a couple of months ago. With the high base already in play, even a slight bit of adverse demand trigger in the US and European markets, could spell trouble. Negative volume growth in some of the key, value added textile export categories does not seem too far-fetched.

That is where the pricing becomes more important, and that too, does not seem to instill a lot of confidence. The major target market of Pakistan’s apparel seems to be struggling, with big players facing multiyear low economic growth scenarios. Volumes alone may not be the answer anymore. What was a double-digit volumetric growth in four textile export categories – has now been restricted to just one on 7MFY20 basis. And if the prices don’t go up – forget about double digit export value growth – Pakistan will do well to not report negative growth in textile exports.
It remains to be seen if the Covid-19 disrupts China’s trade to a larger degree than what it is today. Pakistan does not really boss the game in categories where China has a sizeable export market, even if it leaves some of its market for the taking, for time being. Ambiguity still persists on the treatment if energy input prices for the textile sector. The export report card doe not look like of a country that claims to be building its next wave of sustainable growth on exports, and the only credit to-date is a reduction in current account deficit.


Comments
Comments are closed.