


Over the last four years, a higher rate of inflation in the rural (versus urban) economy has mystified experts and commentators alike. Ever since Pakistan Bureau of Statistics re-based Consumer Price Index (CPI) to 2015-16, monthly inflation estimates are now disseminated for both rural and urban indices, which as per PBS’ methodology have an approximately 40 and 60 percent share, respectively in national headline CPI. During this period, rural headline inflation has remained higher during 32 out of 50 periods (months) versus urban headline inflation, bucking intuitive understanding of consumer expenditure patterns across various socioeconomic segments.


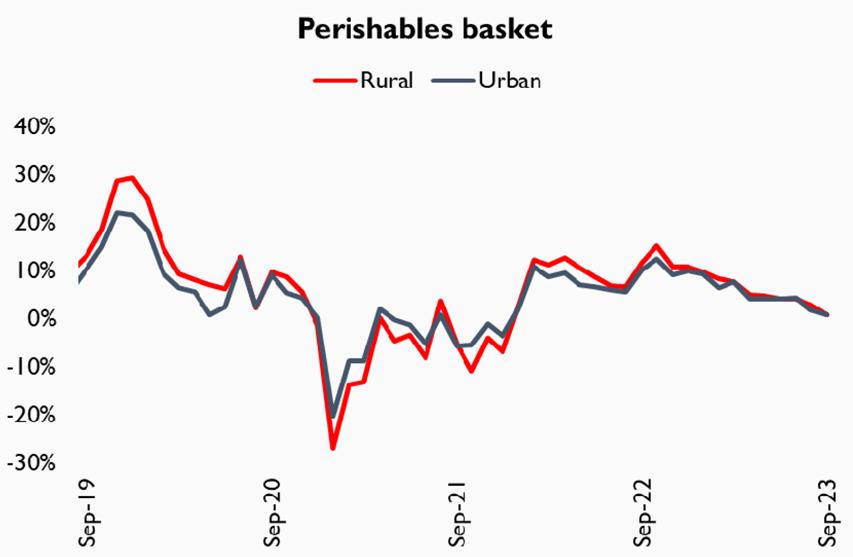
Part of the higher rural inflation phenomenon is obvious: the food commodities subindex has a significantly higher share in rural versus urban inflation CPI –40.9 percent versus 30.4 percent, which partly explains why rural inflation has remained substantially higher than urban inflation in recent years. As per BR Research’s estimates, up to 55 percent of rural headline inflation during the last financial year (2022-23) was contributed by the food commodities basket, compared to 44 percent of urban headline inflation emanating from food sub-index. Since PBS only discloses price indices – rather than actual prices – it is unclear whether prices in the rural economy are actually higher than prices in urban areas. What is obvious, however, is that the pace of price increases – especially within the food basket – is significantly higher for rural consumption centers versus urban (relative to the base period).


But higher weightage of food basket is not the only reason why headline inflation is higher in rural economy. Surprisingly, the rate of inflation for two additional commodity baskets – clothing and healthcare – has also been significantly higher in rural areas compared to urban centers. This goes against traditional understanding that discretionary spending on consumer goods such as apparel and lifestyle is generally higher in urban areas, as PBS indices indicate that the share of clothing in rural inflation has remained significantly higher than that of clothing in urban CPI, despite similar weightage. More importantly, the variance has remained almost consistent over the period under review. Similarly, healthcare prices also show a higher rate of increase in rural versus urban centers, which goes against traditional theory that spending on healthcare is higher among urban populations.
It is unclear what is truly at play. Whether it is the rural prices playing catch up to already higher prices in the urban areas as prices unravel due to hyperinflation over the past 5 years, or are prices of various goods and services actually higher in rural areas compared to urban centers, remains unknown. This can only be answered if PBS were to disclose actual price data for both rural and urban consumption centers, rather than letting analysts rely on price indices alone.
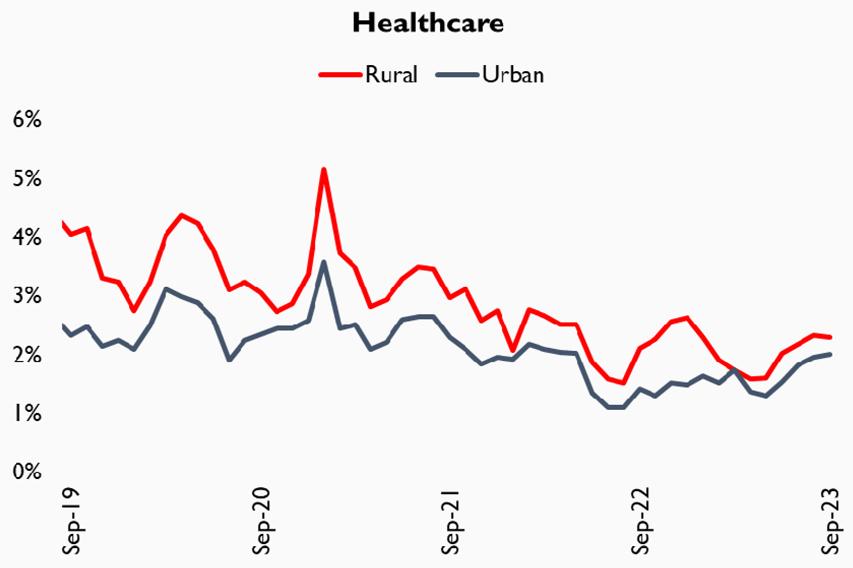

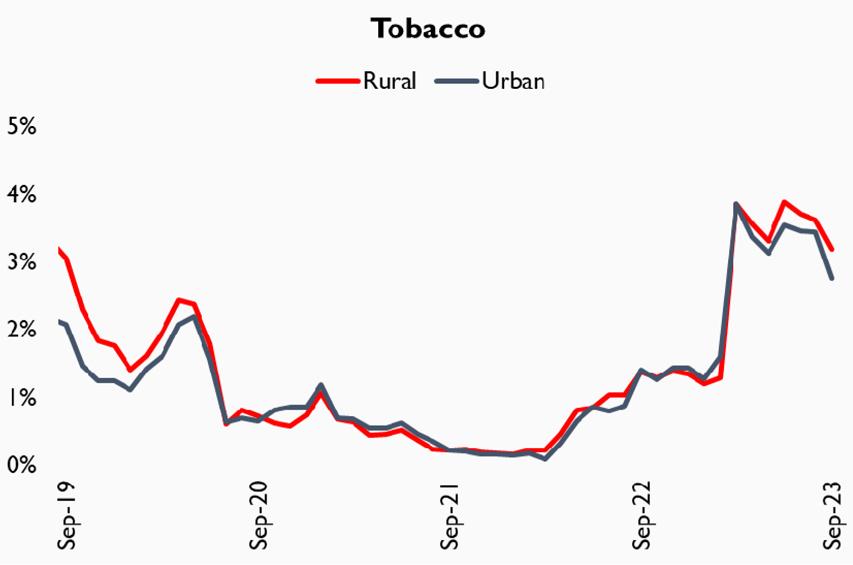
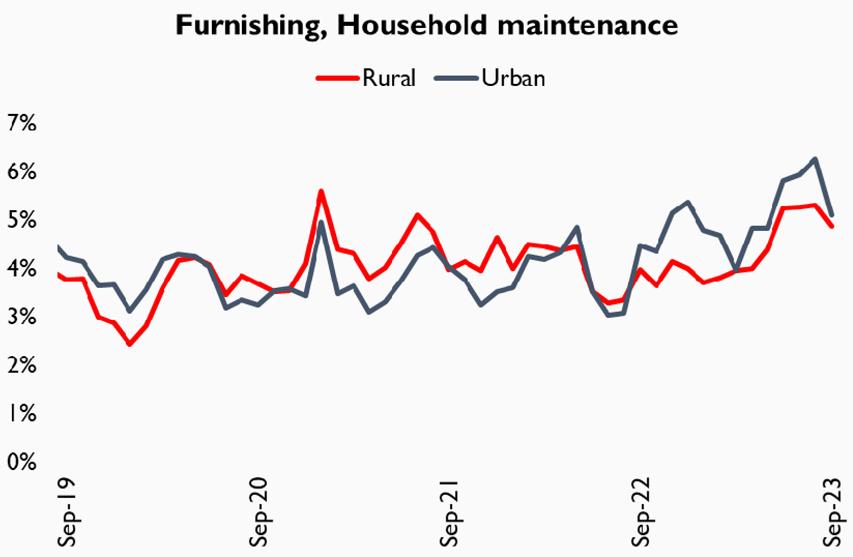
Note: sector-wise graphs denote % weighted average contribution of the segment in monthly headline inflation reading, not impact in points.


Comments
Comments are closed for this article.