


Citi Pharma Limited (PSX: CHPL) was set up in 2012 as a private limited company under the repealed Companies Ordinance, 1984. The company manufactures and sells pharmaceuticals, medical chemicals and botanical products.
Shareholding pattern
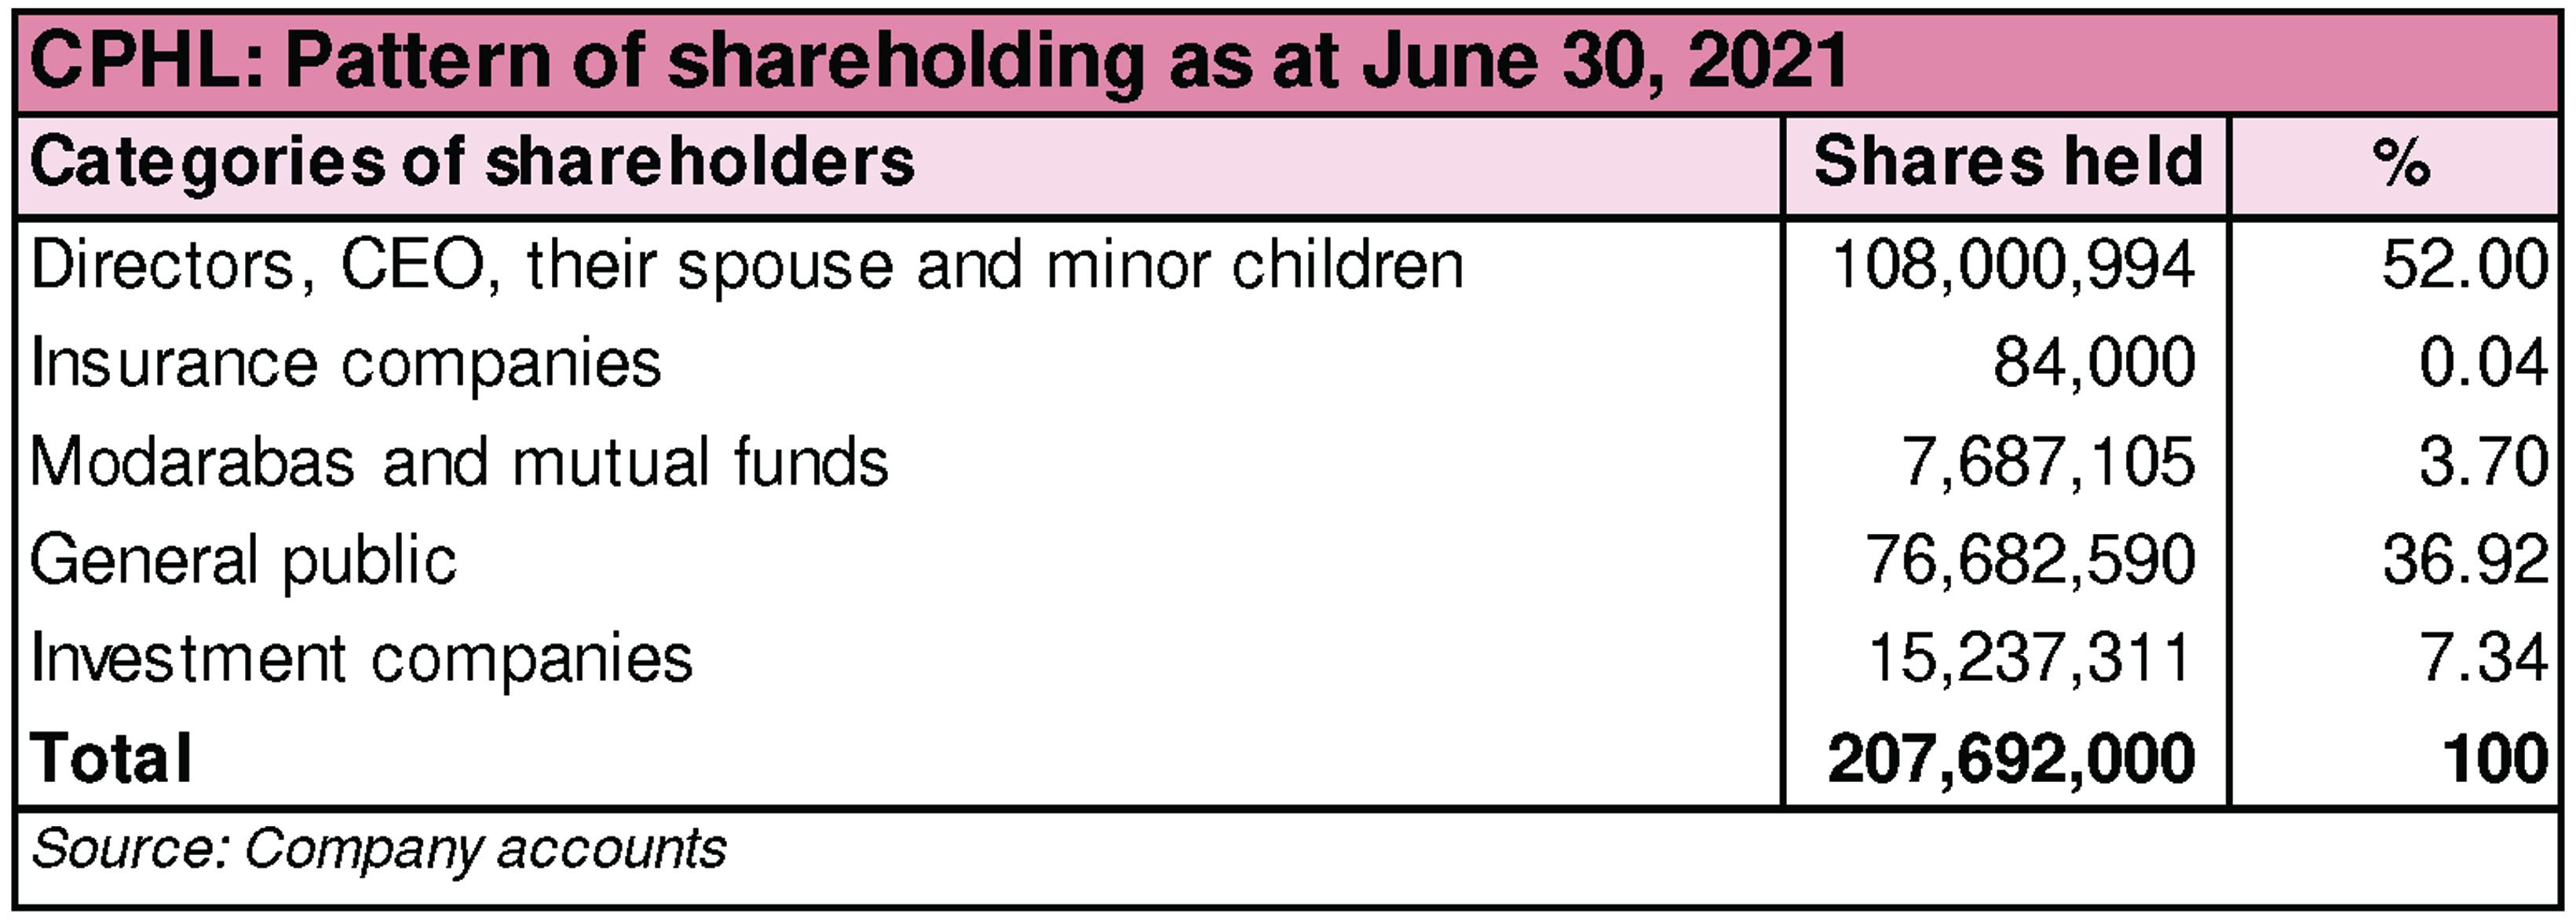
As at June 30, 2021, over 52 percent shares are owned by the directors, CEOs, their spouses and minor children. Within this category, the major shareholders are Mr. Nadeem Amjad, the chairman of the company and Mr. Rizwan Ahmad, the CEO of the company. Close to 37 percent shares are held with the general public, followed by over 7 percent in investment companies. The remaining roughly 4 percent shares are with the rest of the shareholder categories.
Historical operational performance
The company has consistently seen a growing topline since FY17. Gross margin has also been stable throughout, while operating and net margin decreased in FY19, before rising again in FY20 and onwards.
In FY18, topline grew by almost 26 percent to cross Rs2 billion in value terms. Looking at gross values, the year on year increase in revenue was 27.5 percent. Net revenue was impacted by higher sales returns that stood at Rs28 million versus Rs1.2 million in FY17. On the other hand, the cost of production reduced only marginally, thus keeping gross margin stable at over 13 percent. With other factors also remaining similar as a share in revenue, net margin was also marginally better at 5.8 percent compared to 5.3 percent in FY17.

Revenue in FY19 grew by 30 percent to reach Rs2.6 billion as the company continued to expand its operations. Cost of production increased to 87.3 percent of revenue compared to nearly 87 percent in FY18. As a result, gross margin declined slightly to 12.7 percent. Despite the currency devaluation, the proportion of importedraw material as a share of total cost of production reduced from over 87 percent in the previous year to 82 percent in FY19. This can be attributed to a higher closing stock seen at the end of the previous year. However, net margin saw a bigger decline to 1 percent, as selling and administrative expense increased considerably. Within administrative expense, salaries expense saw a substantial increase, while in selling expense, salaries, delivery and marketing expense saw a big revision upwards.

In FY20, topline posted a growth of over 35 percent to reach Rs3.5 billion in value terms. Although a marginal change year on year, cost of production increased to its highest of 87.6 percent of revenue, reducing gross margin to 12.4 percent. With administration and selling expenses reducing as a share in revenue, net margin improved to 4 percent for the year. Note that the company imports nearly all of its raw material needs. With currency devaluation, the cost of raw materials increases as is noted by raw material import expense nearly doubling year on year.Despite this, the company has managed to maintain its overall cost of production that has been increasing only marginally through the years.

In FY21, Citi Pharma witnessed the biggest rise in revenue by over 64 percent, with topline nearing Rs5.8 billion. This was attributed to an increase in selling prices. Combined with a reduction in cost of production to 86.5 percent, gross margin was recorded at an all-time high of 13.46 percent. With administrative and selling expenses reducing further, the higher gross margin also reflected in the net margin that was recorded at 6.07 percent and a bottomline of Rs352 million.
Quarterly results and future outlook
Revenue in the first quarter of FY22 was higher by almost 56 percent year on year as demand continued to grow a year after the first outbreak of the Covid-19 pandemic. With some curtailment in costs, gross margin was better year on year at close to 15 percent compared to 12.7 percent in 1QFY21. However due to an escalation in administrative expense and taxation, net margin was lower at 4 percent versus 5 percent in the same period last year.

Revenue more than doubled in the second quarter year on year. But costs increased to nearly 86 percent of revenue, compared to 81.7 percent in 2QFY21. This can be attributed to currency devaluation. However, net margin improved to 9 percent compared to 7.5 percent in 2QFY21, on the back of other income that increased considerably to Rs58.4 million for the quarter.The third quarter also higher revenue year on year, by over 54 percent. The increase is attributed to general greater health awareness and therefore a higher spending on it. In addition, the onset of Covid-19 has also increased the demand for certain products such as Paracetamol. With some improvement in cost of production, gross margin increased to 12.8 percent compared to 9.8 percent in 3QFY21. This also trickled to the bottomline with net margin at 7.5 percent versus 5.6 percent in 3QFY21.
The company has been witnessing a growing demand in the local market. In addition, it also plans to expand its operations to cater to the export market as well. For this, it intends to enhance its production capacity, for instance of Paracetamol from 3,600 tons per annum to 6,000 tons per annum. Moreover, it also plans to add new APIs to exiting line, as well as formulation products. For the latter, three manufacturing facilities are part of the company’s plan. Thus, the company can produce higher topline results, however, its net profitability is dependent on prime factors such as exchange rates that impact a huge part of the company’s costs.


Comments
Comments are closed for this article.