


Otsuka Pakistan Limited (PSX: OTSU) was set up as a public limited company in 1988. A year later, in 1989 it commenced commercial production of intravenous solutions. It also trades pharmaceutical products, nutritional foods and medical equipment. The company is an indirect subsidiary of Otsuka Pharmaceutical Company Limited, Japan.
Shareholding pattern

As at June 30, 2021, nearly 68 percent shares are held in associated companies, undertakings and related parties. Within this, nearly 45 percent shares are owned by M/S Otsuka Pharmaceutical Company Limited. The local general public owns over 17 percent shares followed by 10 percent held in “others”. The directors, CEO, their spouses and minor children own roughly 3 percent shares. Within this, a major shareholder is Mr. Mehtabuddin Feroz, one of the directors of the company. The remaining about 1 percent shares is with the rest of the shareholder categories.
Historical operational performance
Otsuka Pakistan has mostly seen a growing topline with the exception of FY13 and FY14, while profit margins in the last six years grew after FY16 and dipped in FY19, and then rose again until FY21.
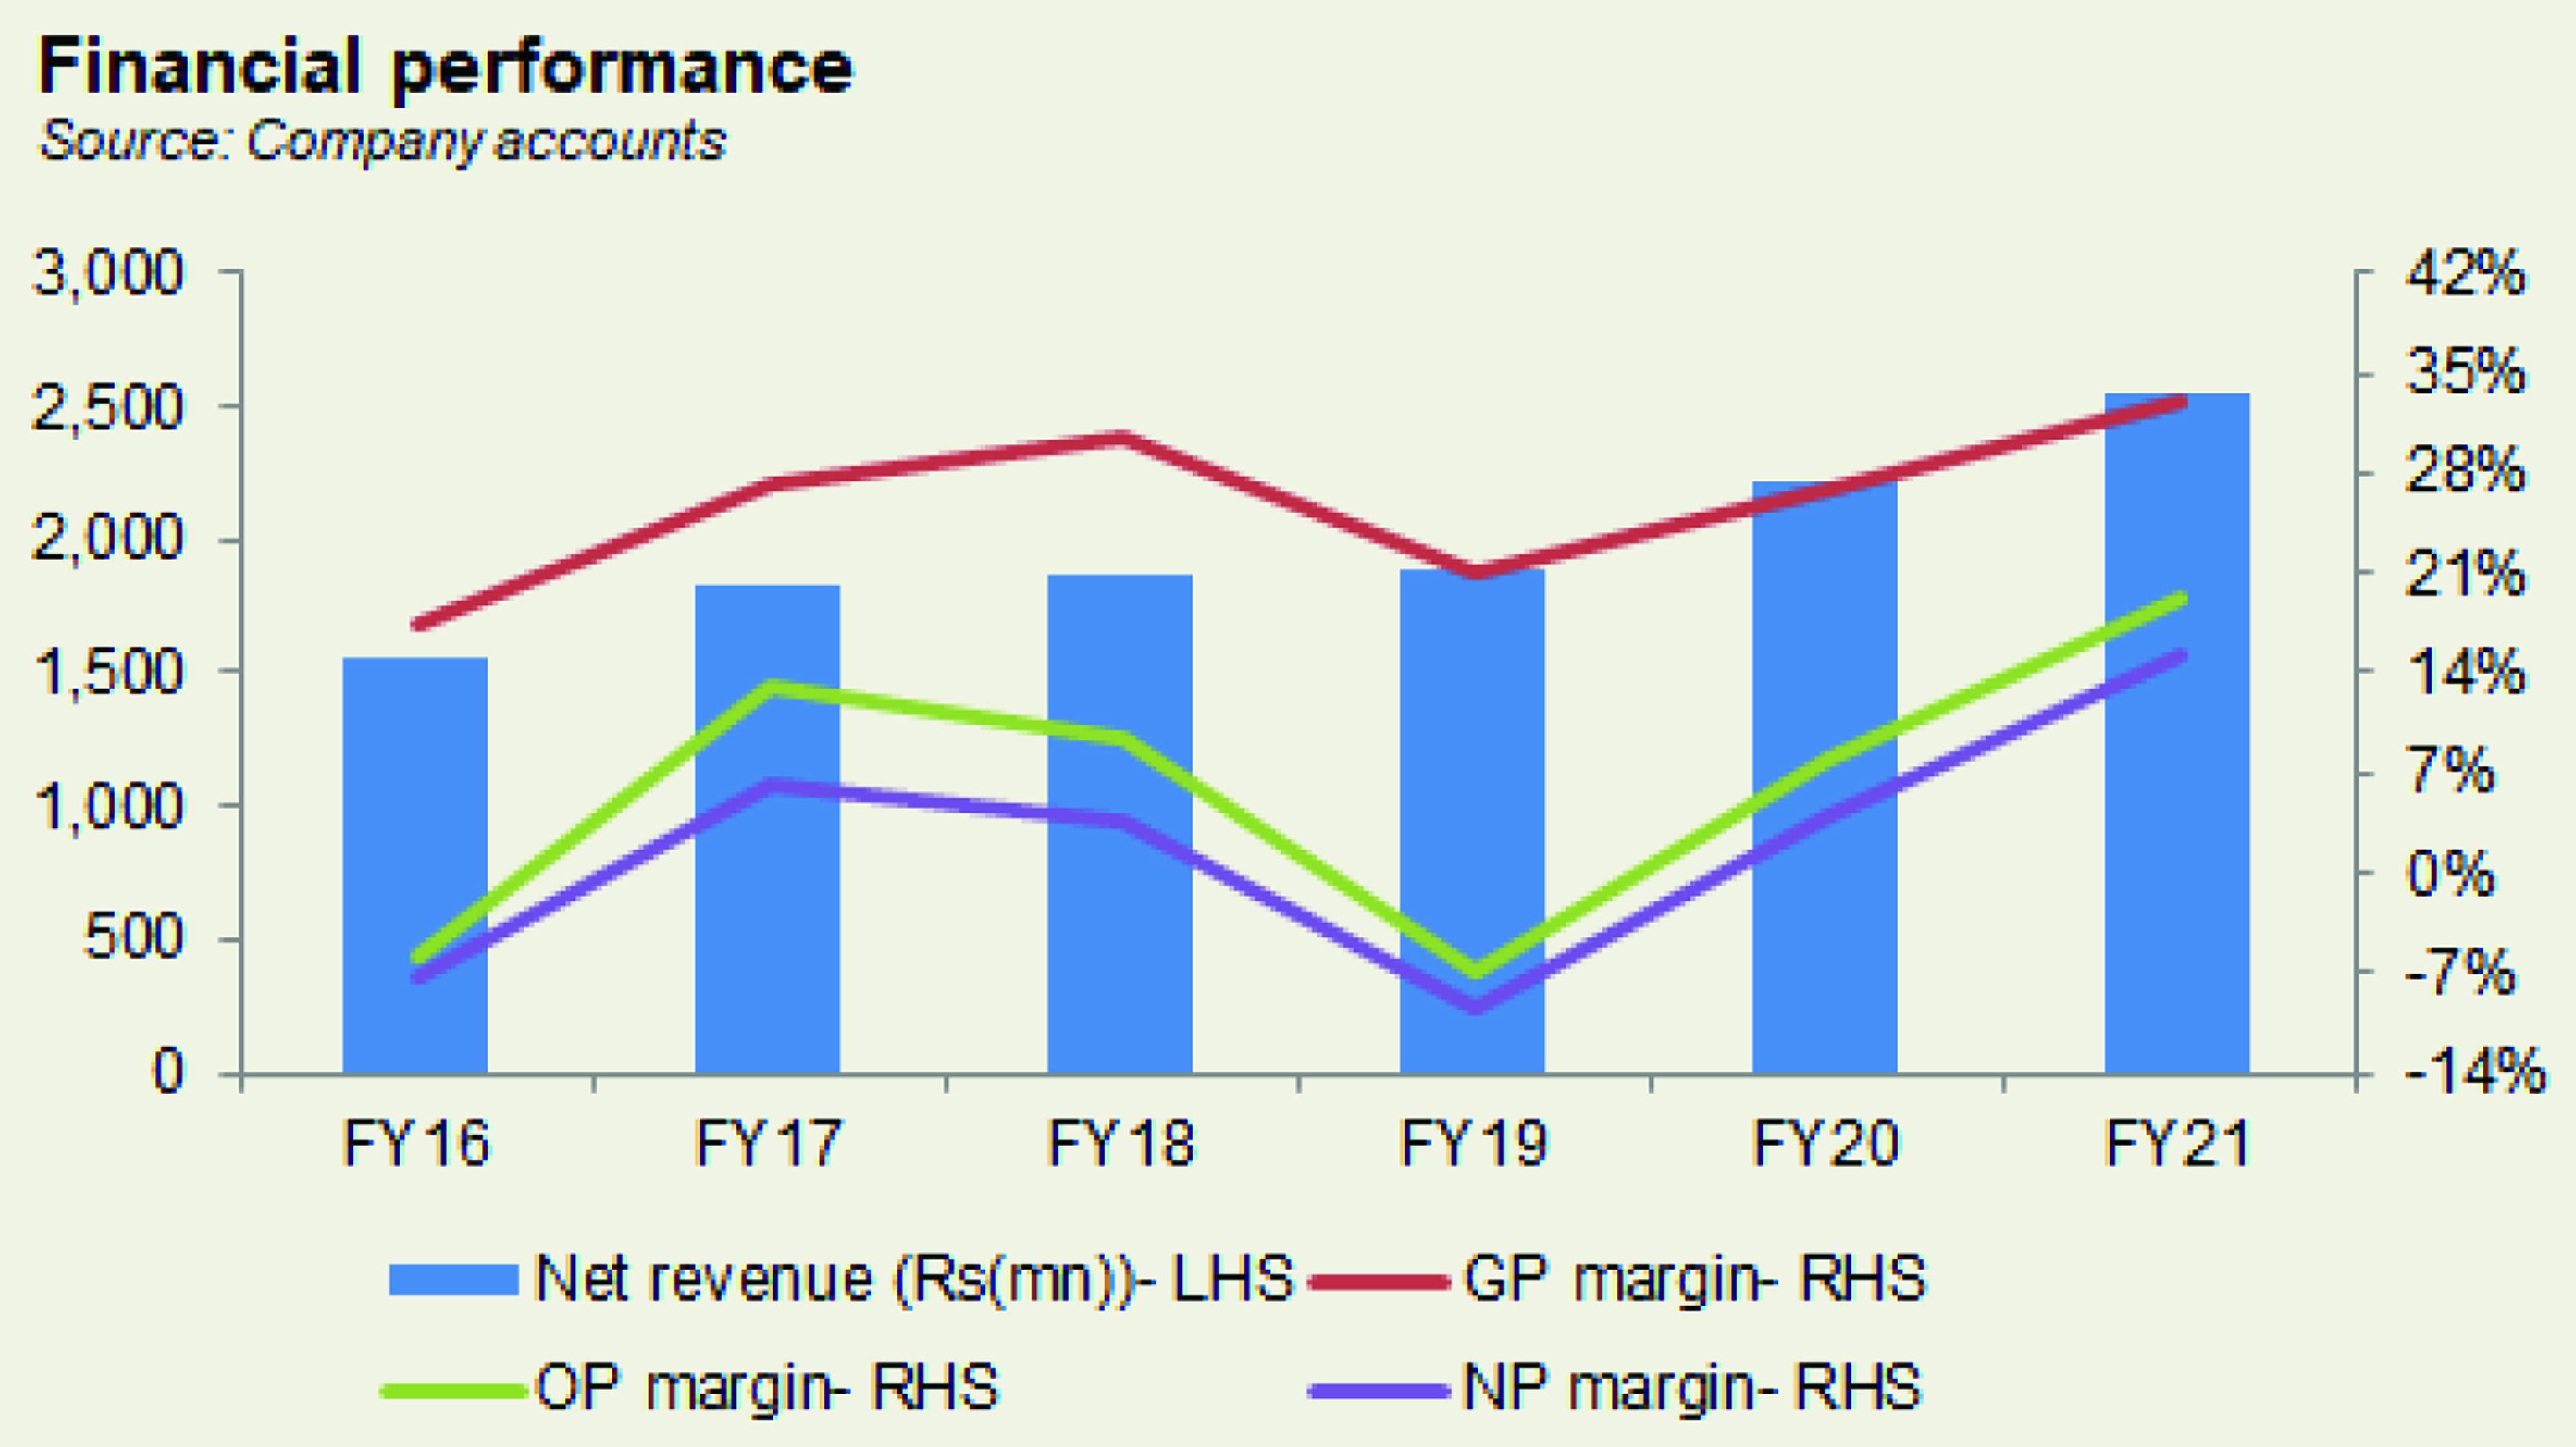
In FY18, topline registered a marginal growth of 2 percent. The lack in growth was due to a situation of over-supply in the market, as well as competition in the IV sector. However, gross margin grew to 30.5 percent from last year’s over 27 percent, on the back of reduced cost of production. But an overall increase in operating expenses as a share in revenue kept this from translating into a higher net margin that was recorded at a lower 3.5 percent, compared to last year’s 6 percent. The increase in operating expenses, in particular, was substantial due to a significant exchange loss- a result of currency devaluation. Additionally, other income also reduced due to the absence of a net exchange gain.

In FY19 too, growth in revenue was marginal at close to 1 percent, again attributed to over-supply and severe competition. Unlike last year, cost of production escalated to 79 percent of revenue, up from last year’s 69.5 percent that reduced gross margin to 21 percent. This was largely a result of currency devaluation that made imports expensive, and pharmaceutical sector is an import dependent sector. PKR/USD exchange rate parity grew from 121.5 to 160.05. This was also reflected in other expenses that grew to consume 12 percent of revenue. Net exchange loss was substantial at Rs 193.7 million. Thus, the company incurred an operating loss of Rs 128 million that increased to a net loss of Rs 175 million as finance expense also increased due to rising interest rates.

Revenue growth recovered in FY20 as topline grew by 18 percent to cross Rs 2 billion in value terms. This was attributed to an increase in sales of Clinical Nutrition (CN) products. Additionally, the company “materialized impact of last year price increase during current year sales”. On the other hand, cost of production reduced to 73 percent of revenue that raised gross margin to almost 27 percent. In addition, net exchange loss was also nearly absent, coupled with an overall reduction in operating expenses as a share in revenue. Thus, net margin improved to 4 percent for the year.

Growth momentum continued in FY21 as revenue grew by over 14 percent to reach Rs 2.5 billion in value terms. This was again a result of an increase in sales of Clinical Nutrition Products. In addition, cost of production fell to an all-time low of almost 67 percent, thus gross margin also peaked at over 33 percent. Overall also, operating expenses reduced as a share in revenue, while other income contributed Rs 107 million towards the bottomline, of which net exchange gain was Rs 56 million. With finance expense nearly disappearing, net margin also reached a peak of 15 percent with net profit at an all-time high of Rs 386 million.
Quarterly results and future outlook
Revenue in the first quarter of FY22 was higher by almost 19 percent year on year due to better product mix.Cost of production was slightly better at 65 percent of revenue compared to almost 70 percent in the same period last year.This also trickled to the bottomline with net margin at 10 percent during 1QFY22 versus 7 percent in 1QFY21. The second quarter also saw better revenue year on year, by over 29 percent. This was attributed to sale of high value products. Gross margin for 2QFY22 stood at nearly 35 percent compared to over 33 percent in 2QFY21 as Clinical Nutrition and therapeutic drugs scored better margins. However, net margin for the current period was lower at 9 percent compared to nearly 11 percent in 2QFY21. This was due to a higher taxation and a significant reduction in other income.
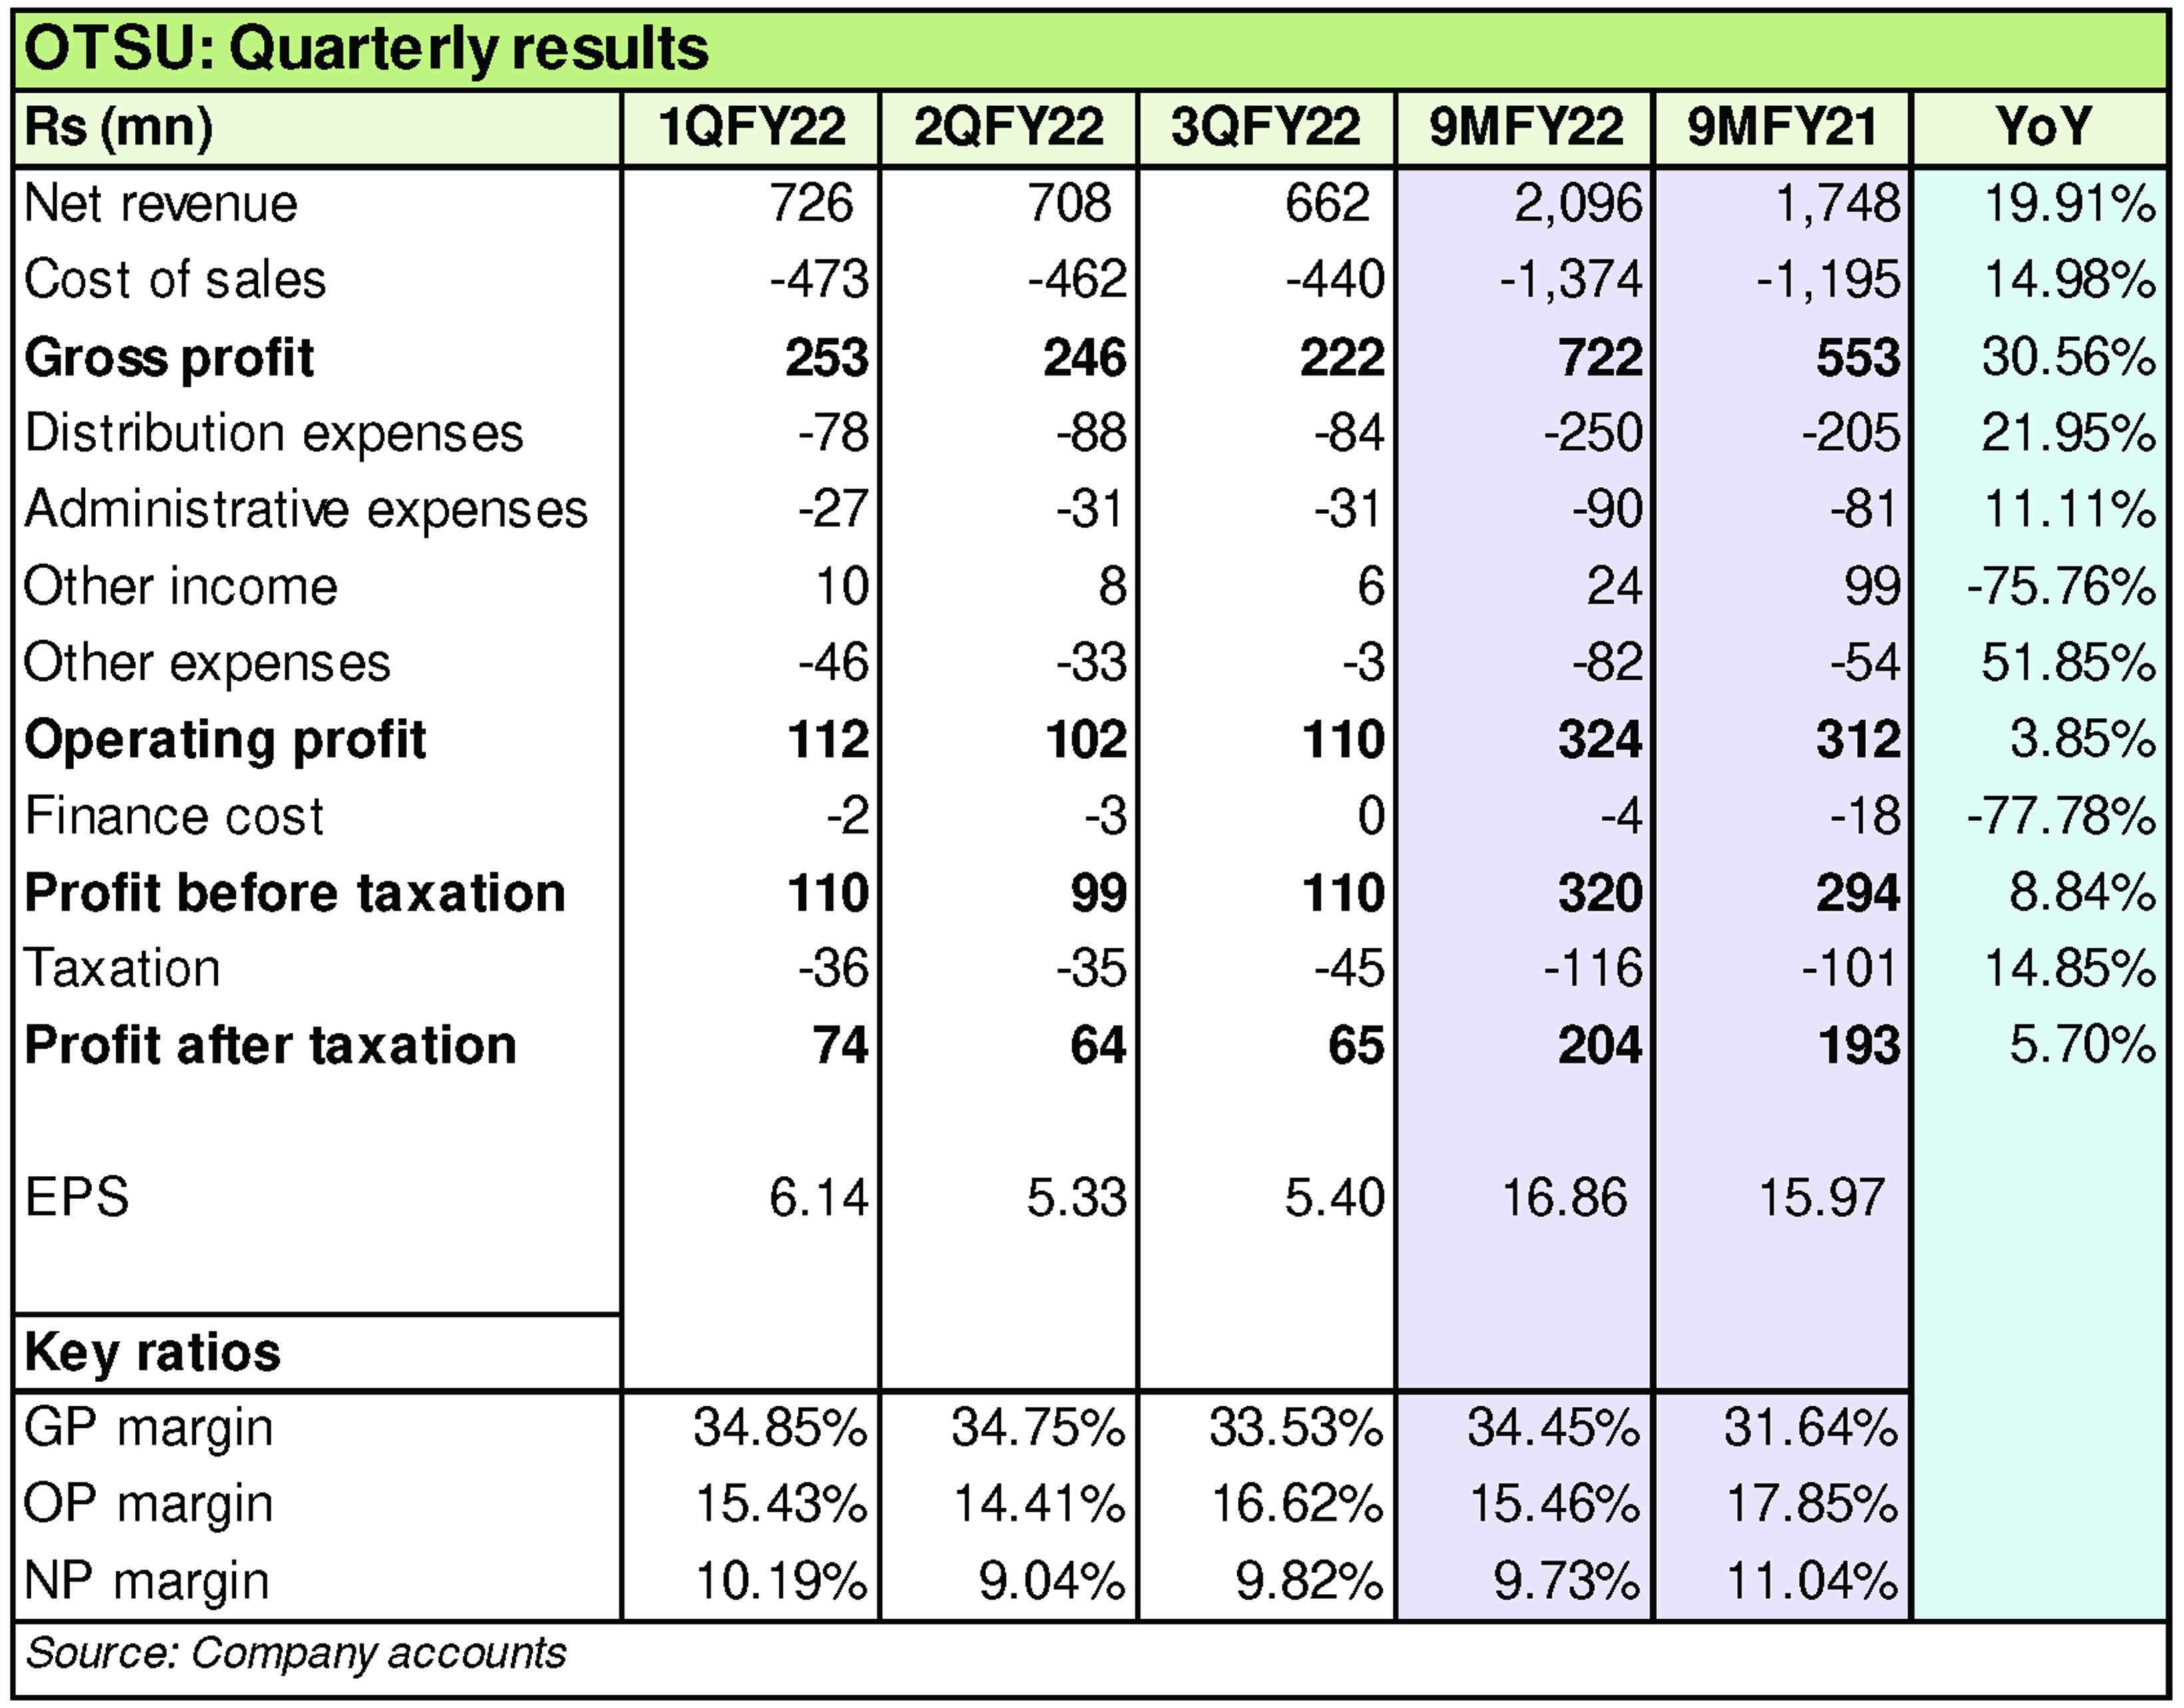
The third quarter saw lower revenue quarter on quarter by 6.5 percent, while year on year it improved by almost 11 percent. This was again attributed to an improvement in sales of Clinical Nutrition products and therapeutic drugs that were high margin products. As a result, gross margin was higher at 33.5 percent compared to 31.3 percent in 3QFY21. However, due to a drop in other income from almost Rs 70 million in 3QFY21 to Rs 5.7 million in 3QFY22, the higher gross margin did not translate into a higher net margin. With the sudden change in government, increase in interest rates, and zero rating of finished pharmaceutical products along with imposition of sales tax, there exists uncertainty regarding the country’s economy. In addition, due to currency devaluation increasing price of imports, future profitability is also uncertain.


Comments
Comments are closed for this article.