

Various studies have shown that smaller businesses have been hit much harder than large businesses by an uncertain pandemic year that was marked by sporadic lockdowns. How has the microfinance sector done? Recent statistics for the Jan-Mar quarter, released by Pakistan Microfinance Network (PMN), the association of microfinance providers (MFPs), allow a comparison for a full year after pandemic started in March 2020. If aggregate numbers are any guide, Pakistan’s microfinance sector seems to have fared well during the pandemic, but there are disparities among MFPs within the sector.
As of end of March 2021, the number of active microfinance borrowers had reached 7.6 million, reflecting a growth of 4 percent since March 2020. As the illustration shows, the count had declined in the middle of the last year, but it has bounced back earlier this year, thanks in part to digital loan products. The fact that nearly 6 lac borrowers were added in three months between December 2020 and March 2021 is encouraging. In fact, it marks the falsest quarterly acquisition of new borrowers in recent years.

The pace of recent growth will need to sustain, however, considering the large potential addressable market of ~41 million micro clients and ~6 million micro enterprises (as per a 2019 PMN study). In terms of financing, the gross loan portfolio stood at Rs340 billion as of March-end 2021, reflecting a growth of 10 percent since the pandemic set off. The lending level increased by Rs32 billion over the year, suggesting continued MFP appetite to lend and uptick in borrowing demand.
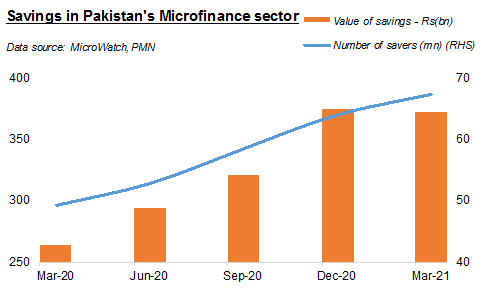
While credit numbers look better than before, where the sector really shone through in a difficult year is in the area of “savings”. As of March-end 2021, the value of savings stood at Rs373 billion, a significant jump of 41 percent since the pandemic set foot in the country. The number of savers had grown by 37 percent year-on-year as of March 2021 to reach 67 million. There was an addition of 18 million new savers over the year under review, thanks mainly to the growing usage of mobile wallets.
There was a marginal decline in the value of savings between December 2020 and March 2021 despite growth in number of savers, suggesting deposit outflows from traditional bank accounts. Still, the fact that Rs109 billion more were raised in deposits (which are a cheap source of financing for MFPs) in a single year marks the fastest pace of absolute growth in recent years. During the year, the value of incremental deposits was about 3.5 times the value of incremental loans extended to individuals and enterprises.
The improvements seen in the above metrics of credit and savings are mainly led by microfinance banks (MFBs), who can raise public deposits and access the central bank’s supportive measures from time to time. The non-banking microfinance companies (NBMFCs) – which include rural support programs and grassroots organizations – don’t have such avenues available. Their infection ratio (portfolio-at-risk: greater than 30 days) has also increased during the pandemic, from 3.3 percent in March 2020 to 5.6 percent in March 2021. (For MFBs, the infection ratio declined from 6.6 to 4.1 percent in the period).
The above portrait shows a general improvement, but it reflects the situation of the providers in the aggregate. It does not tell us how different segments of microfinance borrowers have fared over the first pandemic year, how many of them were able to access the government’s relief policy concerning loan deferrals/restructuring, how many have had to ride out the storm on their own, how many are facing difficulties in repayments now, or how many of the micro businesses need a loan but can’t get one.


Comments
Comments are closed.