

Another month of current account (almost) in balance. Based on PBS trade data, market had expected a deficit of over $500 million; but the toll stood at mere $47 million. At $2.7 Bn, upbeat performance in monthly remittances has kept them at second highest after July 2020; whereas at $2.62 Bn, monthly exports are second highest after June 2011, as both heads have continued to pleasantly surprise. But what is truly of note is the continued lower services trade deficit and improved other transfers that have diluted the impact of the abrupt pick up in goods import. At $5.2 Bn, monthly imports were second highest after July 2018.
The overall volume of trade and other flows is growing. That is healthy for the economy. The problem in Pakistan is not high imports – as for 220 million population, the number is to be higher to create jobs and ensure consumption. The issue is that there are not enough exports and other avenues in the current account to finance that imports.
The question is whether these flows will continue. Part of the improvement in remittances, other transfer and services exports is perhaps due to shift of informal flows to the formal channel. That appears to be a result of lower travel and strict compliance with FATF conditions. There is a fair chance that some of these flows shall continue to remain in the formal channel even after travel normalizes, and perhaps find a new normal. This will bode well for the country as it struggles to absorb higher imports bill as lowering import bill choked the overall economy. In his second innings, PM has chosen well by removing that option off the table.
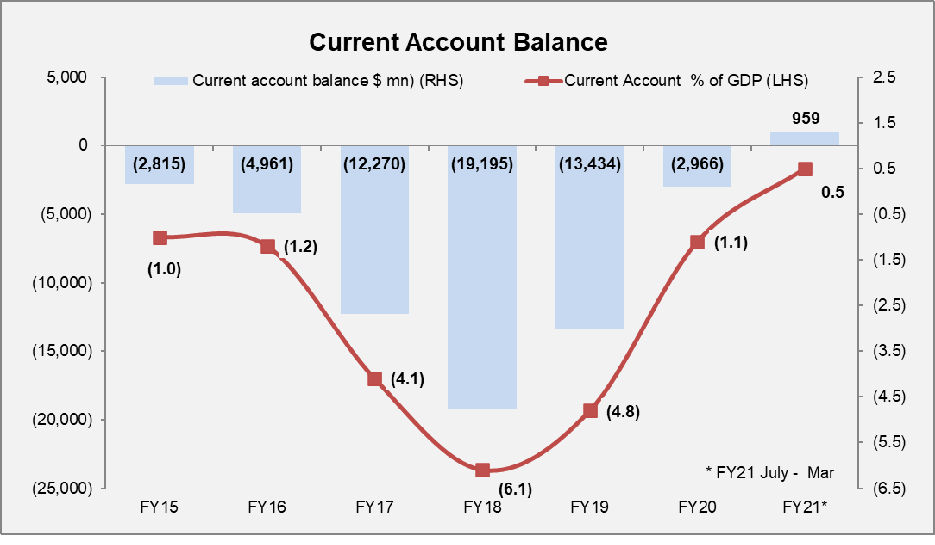
The current account surplus for the 9M stood at $959 million (+0.5 percent of GDP) against a deficit of $4.1 billion (-2.1 percent of GDP) in the same period last year – that is incremental savings of $5 billion (around 3 percent of GDP) on net basis. This implies that the stability has been achieved and policy makers are now confident regarding changing gears of the economy and wish to move on a growth trajectory. There is a good chance that the current account surplus will stretch for the full fiscal year. Last time this happened was during FY11.
Imports stood at $5.2 billion in March 2021. Detailed SBP numbers are not out yet. Based on PBS data, ($5.7 bn), the 23 percent growth in imports on monthly basis is broad based. Higher than average growth was observed in petroleum sector where imports are up by 38 percent (MoM) to reach $1.1 billion. An obvious reason is higher oil prices, averaging at $65.2 per barrel in March against $47.3 per barrel in Jul-Feb. Prices have slightly moved down to $63.7 per barrel in first three weeks of April.
But the increase in prices is not the only reason, as volumes have also increased to 1.3 million MT against 1.1 MT average monthly imports in Jul-Feb, and 0.87 MT in Feb 2021. It appears that imports have picked up due to higher economic activities and curbs on smuggled oil products from Iran. There is no abnormality in RLNG imports which are within historic range.

The other two sectors where higher than average import growth was observed is agricultural/food and other commodities and metal groups. In agri/food group, imports were low during February, while March is not exceptionally high compared to nine-month average. Within metal group, iron and steel is growing at higher pace, up by 67 percent in dollars and 57 percent in volume on MoM. This has led to a toll of 23 percent and 28 percent respectively in 9MFY21. Possible explanations point to boost in construction and automobile segments reflecting in imports figures.
There is no significant change in month-on-month agricultural commodities import (wheat, sugar, and cotton), as the toll stood at $229 million in March and Jul-March import stood at $2.1 billion, 3.8 times of last year same period imports. This space has commented repeatedly on how agricultural commodity imports may become the new norm due to stagnating productivity in domestic production.
Machinery imports are up by 16 percent on monthly basis to $1.1 billion in Mar 2021, and up by 8 percent to $7.2 billion in Jul-March. The impact of TERF has started reflecting, total Rs435 billion ($2.8 bn) will be booked in machinery imports over the next few months. Within machinery, biggest import head is cellphone import which are primarily meant for end consumer. The toll has stood at $224 million in March, up by 28 percent MoM; and $1.5 billion in Jul-March, up by 57 percent YoY. Not only usage is increasing but payments against most mobile phone imports are now made through formal channels.

The transport group imports are moving up with bonanza in automobile sales continuing due to low interest rates and new cars coming into the market. The compact SUVs sales are picking up and these on average have higher prices with lower localization (as variants have been recently introduced). These are all reflecting in higher imports numbers. Transport group imports are up by 12 percent (MoM) in March to $322 million and up by 73 percent (YoY) to $1.6 billion in Jul-Mar.
The exports numbers (based on SBP data) are very encouraging at $2.6 billion – up by 20 percent against Feb 2021, whereas 9MFY21 exports stood at $18.7 billion – up by 2 percent YoY. Detailed numbers are not out yet. Based on PBS data, March exports are up by 14 percent to $2.37 billion on monthly basis. The data is encouraging, and highest increase is witnessed in other manufacturing items. The impact of high cotton prices is yet to reflect on the high value-added textile prices. Last time exports were north of $2.6 billion (SBP data) happened in June 2011, when cotton prices were more than double of what they are today.
Food exports are up by 17 percent in Mar 2021 on monthly basis. Within rice (especially basmati), fish and meat exports are up by over 20 percent. Basmati rice exports increased by 73 percent in a month – its highest value. Overall food exports in Jul-Mar are down by 2 percent YoY; but March numbers are very encouraging. Let’s see whether the trend shall continue.

Within textile exports, there is little exciting in March as they are up by 10 percent compared to last month. Similar is the increase in 9MFY21, up by 9 percent. The story is well established – there is decline in exports of low value-added items – cotton yarn and cloth; and higher increase in high value-added items – knitwear, bedwear and towels.
The game is probably picking in other manufacturing items. Here the government’s support is minimal. There are small groups who do not have lobbying power like the big textile boys. Its heartening to see that in March exports are up by whopping 41 percent to $357million. On aggregate basis, 9MFY21, exports are up by 6 percent to $2.6 billion.
The overall goods trade balance worsened by 18 percent in 9MFY21 ($18.7 bn) and 12 percent in March to $2.6 billion. The better story of service trade continues due to low travel and pick up in IT exports. Exports in services is up by 16 percent in March on MoM as IT exports reached $213 million in 9MFY21, IT exports are up by 44 percent to $1.5 billion. That is encouraging and some of this growth is attributed to new business coming in due to COVID and some could shift from formal to informal sector.
The story of low services imports is now well established, down by 20 percent to $5.7 billion in 9MFY21. Low travel tickets expense and other services expense associated with the travel is contributing to the decline. Moreover, dollar buying from the open market is down due to less travel and exchange companies are selling in the interbank market which are eventually bought by SBP to lower its forward/swap liabilities or to help finance imports and help currencies appreciate.
The trade and services deficit worsened by 7 percent to $20.0 billion. The overall balance in the primary income account has improved by 13 percent with the deficit standing at $3.6 billion. The real benefit in the current account is from the secondary income account – remittances and other current transfers. The surplus is up by 31 percent (or $5.9 bn) in 9MFY21 to $24.6 billion.
Worker remittances continue to be the star performer – up by 20 percent to $2.73 billion in March. The 9MFY21 toll is up by 26 percent to $21.5 billion. The momentum of $2.5 billion+ monthly remittances is likely to continue in April as Ramazan and Eid related flows will keep it high. Later, the increase in flows due to meaty Eid will keep it high as well. The other current transfer (aid and donation) related flows are up by 96 percent in 9MFY21 to $3.1 billion. In March, these flows were down by 28 percent to $287 million on monthly basis. These flows may increase in coming months as in Ramzan and Eid season donations (zakat) usually peaks.
On the counter, the open market demand for Umrah and Hajj seasons will remain subdued and that will bring more foreign currency from open market to interbank to keep currency flows in favor and would help SBP to lower its forward/swap liabilities further. In a nutshell, less travel and pick up in exports is helping to finance much needed growth in imports (to boost GDP growth).
SBP reserves are building because of these reasons as well as due to other flows – Eurobond issuance, IMF and other bilateral money and RDA flows (majority of these flows are not in current account). The SBP reserves are at $16 billion and overall foreign reserves are at $23.2 billion, $1.3 billion shy of all-time high touched in $24.5 billion. SBP’s target should be to take this number to $30 billion by Dec 2021.


Comments
Comments are closed.