


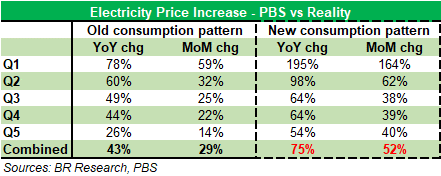
The Pakistan Bureau of Statistics (PBS) calculated the impact of electricity price increase as 29 percent and 43 percent on month-on-month and year-on-year basis, respectively. Electricity alone was the single largest contributor to the headline inflation, and the sole reason why core inflation inched up having stayed static for over eight months.
But there is more than what meets the eye. PBS uses a much improved and revised methodology to calculate the impact of electricity prices on CPI. It now makes room for monthly fuel adjustment and bases the methodology on consumption weights. The one shortcoming that was apparent and which has at times resulted in true price change not been reflected in the methodology, has been the inability to make room for the reality that domestic consumers enjoy benefit of the previous slab.
Nevertheless, the recent electricity price increase was unique in the way that it spared none. From the domestic consumer in the lowest category to the industrial consumer in the highest consumption category – everybody has been subject to a uniform tariff increase of Rs1.95 per unit. The sanctity of the decision could be left for discussion some other day, whether it makes sense to expose the most vulnerable to a higher proportionate increase than the affluent. But the impact it has on inflation is an interesting one.
It is fair to acknowledge upfront that it would be too much to ask of the PBS to incorporate changes in consumption slabs just a year and a half after a rather comprehensive exercise. Even if the consumption slabs have turned upside down, it is of little to no value of continuing to use the old consumption slabs for different income quintiles. At the worst, it will only just lead to the actual price change faced by different income strata not being reflected. So what? No one here is looking for preciseness. Rules, policies, and bureaucratic procedures must sure take precedence.
Enough of digression. Back to the tariffs and the CPI impact. In plain vanilla terms, the electricity tariffs have increased by 29.45 percent month-on-month, as per the PBS methodology, from a combined average of Rs11.47 per unit to Rs14.23 per unit. That, on year-on-year basis have jumped by 43 percent from Rs9.92 per unit.
Remember that the PBS takes no account of the fact that domestic consumers still enjoy the benefit of a previous slab, which makes the actual price lower than how PBS sees it. In terms of increase, there is not much difference though as the omission is consistent. The actual change also sits around 27 percent month-on-month and 48 percent year-on-year at Rs13.23 per unit.
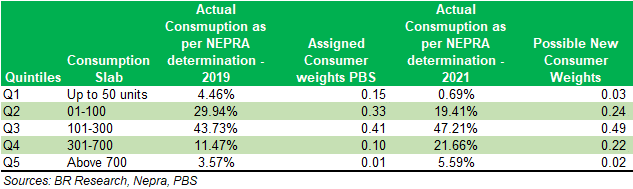
So, not really a big deal one may say – as the purpose is to record the price change correctly – and in this case, it is closer to reality. But it changes altogether when you consider the reality that the new tariffs determined by Nepra are based on an entirely changed set of consumption slabs, which should ideally lead to very significant changes in consumer weights and slab for each of the five quintiles.
Whether or not the PBS should have done it or if the rules applied do make changes midway (although there is precedence in recent past), it does not change the fact that the new reality would mean a vastly different electricity tariff regime, than what the PBS inflation numbers would report till the time the next rebasing exercise happens (and that won’t be anytime soon).
When plotted against the new consumption pattern as laid out by Nepra in its tariff determination, the year-on-year and month-on-month electricity tariff increase comes at significantly higher 75 and 52 percent, respectively. The impact on the five quintiles is vastly different too, as the lowest income quintile is subject to the highest increase of 198 percent year-on-year. This alone take the electricity impact alone to 3.4 percentage points instead of the 1.96 that it represents on the existing methodology.
But it appears 43 percent year-on-year increase is what will continue to be used. What must be kept in mind that the year-on-year increase will continue to be on the higher side as the government had put a freeze on monthly fuel cost adjustments for nine months from November 2019 till July 2020. Ever since, the monthly FCAs have averaged a significant Re1 per unit. Another quarterly tariff adjustment of Rs0.8 per unit is just around the corner, which should take the effective tariffs even higher for another year. There is no respite in sight!


Comments
Comments are closed for this article.