


Every few weeks some research house, or a multilateral institution publishes growth projects based on some internal model, which is often a black box. Depending on perceived stature of the institution making forecasts, considerable noise is created around those forecasts often with a partisan spin. Not much has been written about how accurate those forecasts are, relative to actual numbers. Over the next few weeks, we may dissect forecasts provided by various institutions, and try to figure out how successful they are in projecting GDP growth rates.
International Monetary Fund (IMF) releases its World Economic Outlook (WEO) every year, often with special editions, or updates multiple times in a year. Utilizing GDP growth projects for Pakistan as published in WEO since 2001, it can be seen that IMF has underestimated growth by an average of 0.52 percent over the last twenty years. The difference between ‘actual’ and ‘projected’ has been as low as five basis points, to as high as 479 basis points – exhibiting significant dispersion. Standard deviation of the difference is almost 3.7 times the average, with difference of one percent materializing in ten years during the last twenty years.
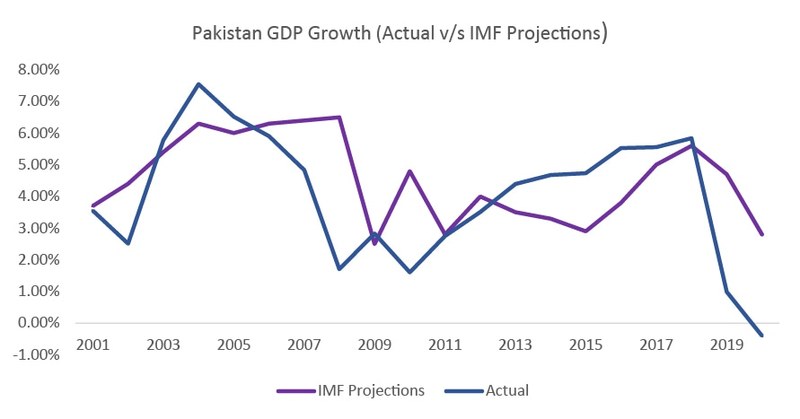
The average is certainly being skewed by systemic events, such as the 2008 global financial crisis, or the more recent COVID-19 pandemic. Such tail-risks cannot potentially be captured in projections, and hence are an inherent weakness of vanilla macroeconomic modeling. Excluding outliers which can be attributed to systemic events and external shocks, the average difference between ‘actual’ and ‘projected’ decreases to 4.9 basis points – however, dispersion remains high, with standard deviation being almost 2.8 times the average. The scatterplot below further illustrates the same. Dispersion of difference between actual and projected numbers weakens the predictive ability of such projections. Inability of such projections to incorporate external shocks, and tail-risks further adds a layer of uncertainty. Projections can provide direction, but they may fail at estimating the magnitude of that direction. A review of available data for the twenty first century demonstrates large divergence between actual and projected growth levels – a departure from a cookie-cutter black-box driven approach to a more localized approach may assist in reducing such divergence.


Comments
Comments are closed for this article.