

Shahtaj Textile Limited (PSX: STJT) which is part of the bigger Shahnawaz Group Company, was established in 1990, as a public limited company. It started its commercial production, two years later in 1992. The company’s main business is to manufacture grey fabric and market it. Its production facilities are located near Lahore, Pakistan.
Shareholding pattern
Directors, CEO, their spouses and minor children hold majority of the shares of the company- at a little beyond 38 percent. Of this, most are with Mrs. Amtul Bari Naeem, closely followed by Mr. Muneer Nawaz, the chairman of the company. The foreign general public collectively holds 33 percent of the shares, while nearly 12 percent are held with the associated companies, undertakings and related parties. This category solely includes Shahtaj Sugar Mills Limited. The remaining around 17 percent is distributed with the rest of the categories.
Historical operational performance
Topline and profit margins, both have been fluctuating throughout the decade, with the former changing at varying rates.

During FY15, Shahtaj Textile registered an 18 percent decline in its revenue. This could be attributed to lower prices, as during FY14 as well there was a 4 percent decline in revenue. A breakdown of sales reveals that “indirect” exports saw the most decline from Rs 1.7 billion in FY14, to Rs 856 million in FY15. On the other hand, the company was able to curtail costs, which reduced to consume 90 percent of the revenue, down from almost 93 percent in FY14. This allowed profit margins to improve despite the 18 percent decline in revenue.
In FY16, topline further declined by 4 percent. This was attributed to production being halted as a result of maintenance and BMR activities. The company has air jet looms, some of which were closed down for maintenance while some were replaced. Since production is usually uninterrupted, any halts in the production process results in production losses, which was evident from lesser number of days worked than the usual 365, hence lower production as well; shifts per day was also lower to 2, instead of 3.
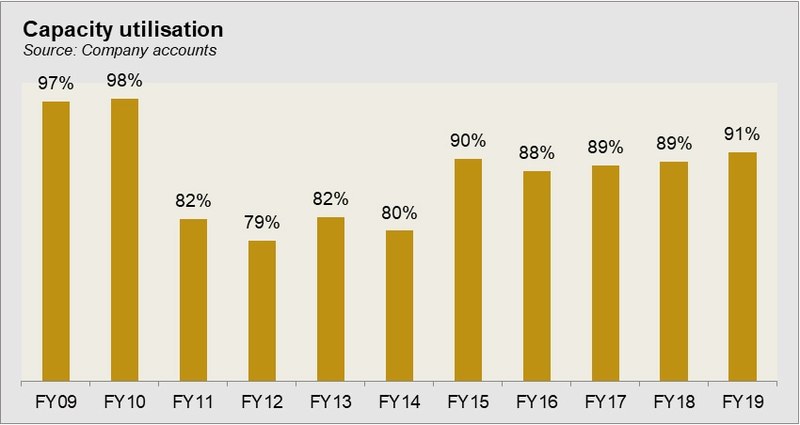
However, despite the lower production, and production losses, the company managed to maintain and grow its profit due to control on costs. This came about as a result of lower fuel expense, and a subdued figure for plant and machinery written off which stood at Rs 3.2 billion in FY15.
The company’s topline growth recovered in FY17 as it grew by nearly 11 percent. Some part of this incline was attributed to better production post-BMR. Better sales figure was mostly brought in by higher local sales, while the country still remained uncompetitive in the international market. However, the market had not been very supportive, with buyers not keen to build up inventories, thus having a negative effect on fabric prices. Moreover, with a higher cost of production, for the sector in general, as well as for the company, profit margins could not see a similar rise as seen in topline. Although in rupee terms, the bottomline did see an increase, but as a percentage of revenue it remained lower than FY16.
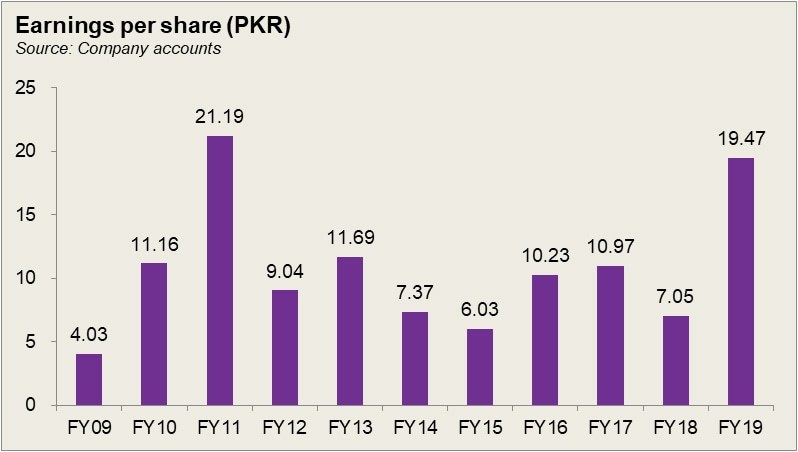
Topline further grew in FY18 by a little over 12 percent. This was primarily attributed to the currency devaluation which made exports from the country competitive along with export rebate announced by the Government of Pakistan for 2017-18. In addition, the BMR activities undertaken in the previous years allowed for higher production. Prices also improved as price for yarn also increased. However, this not only caused an increase in revenue, but also costs, which consumed more than 92 percent of the revenue. Although other income, arising from a net exchange gain increased, it could not lift margins, as the incline in fuel and depreciation expense exceeded it. Thus, the net margins were the lowest in the decade.
Shahtaj Textiles saw the highest growth rate in topline at almost 22 percent, which according to a representative of the company was mostly due to currency devaluation. Both local sales as well export sales saw an incline. The company benefits not only from its own exports, but also when it sells locally to other players in the market. When the latter export and earn a benefit, the effect trickles down to Shahtaj Textile’s business as well. The cost of production reduced due to reduction in the price of RLNG by the government for the export sector. As a result, profit margins improve to touch the highest level, last seen nearly a decade ago, in FY11.

Quarterly results and future outlook
There was a marginal increase in topline of 1.6 percent during 9MFY20 year on year due to increase in unit selling prices, while cost as a percentage of revenue was also lower compared to 9MFY19, which allowed gross margin to improve year on year. Other income was nil this year, while expenses rose. This was due to currency appreciation in the first quarter which resulted in net exchange loss.
The company obtained a license to manufacturing bond scheme as of December 2019 which would allow them to import duty-free raw materials. The effect of this maybe translated in the form of lower cost of production for FY20. However, this may be offset by the production losses due to the ongoing pandemic and the resultant lock down which has kept the mill shut. With another lock down in place, production and sales volumes are expected to go down.


Comments
Comments are closed.