


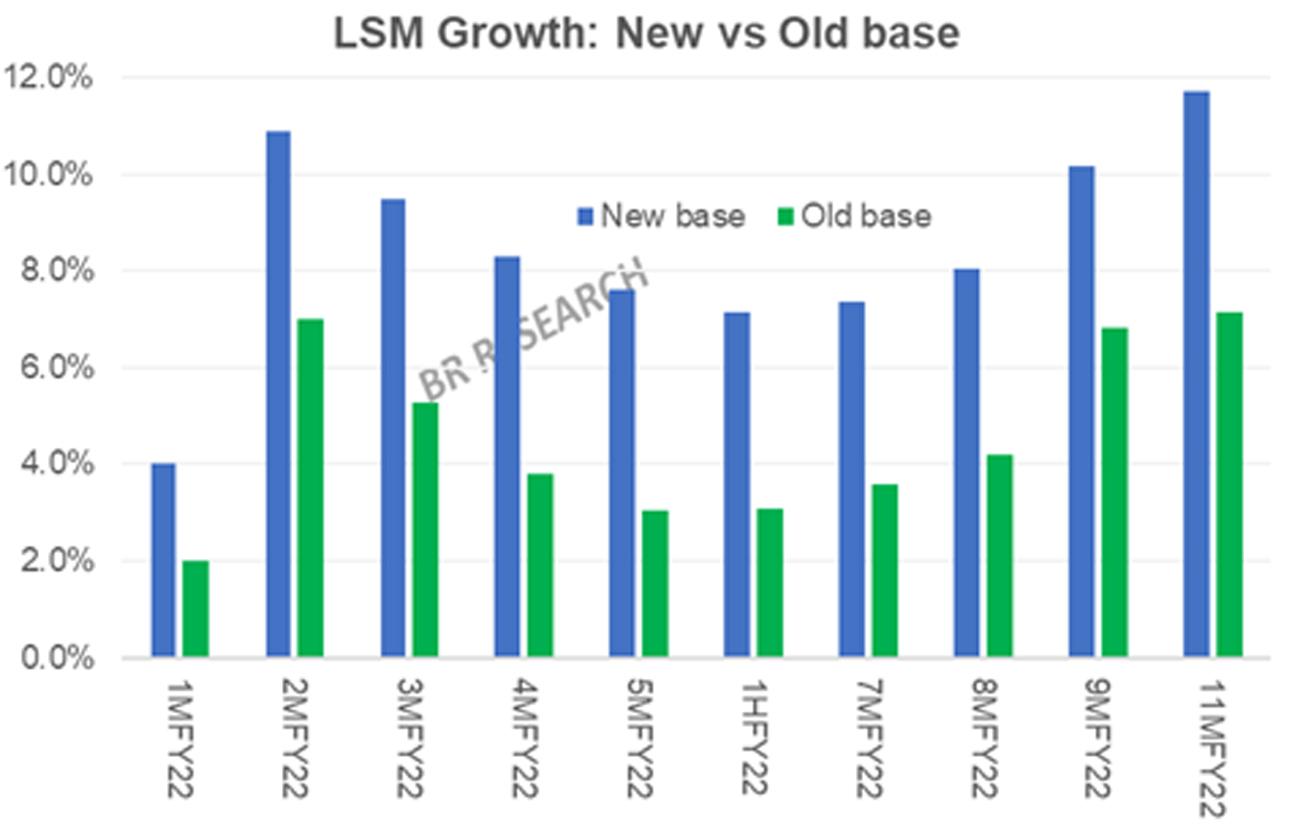
It may well be an entirely different picture in two months from now, but for 11 months of FY22, the Large-scale Manufacturing (LSM) growth at 11.7 percent sits rather strong. On the previous base of 2005-06, LSM growth is at a rather modest 7.13 percent for 11MFY22 – nearly half of what was achieved in 11MFY21. A significant change in the methodology viz-a-viz inclusion of new items (mostly export quantities) is responsible for most of the difference between the old and new base growths.
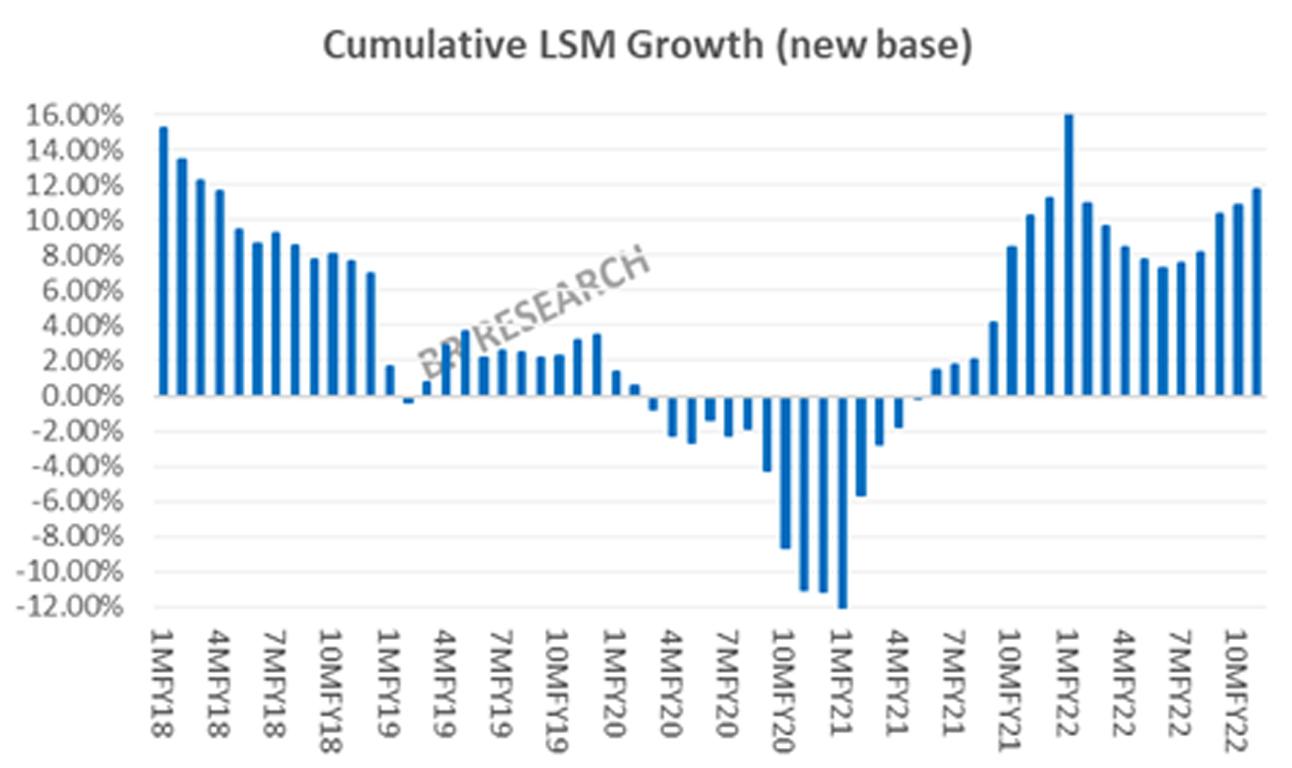
That said, the respective monthly and cumulative indices, on both new and old base, are at all-time highs, reflecting the industrial activity has taken off rather well. Ninety two of 123 or 75 percent items tracked in the revised LSM methodology show positive year-on-year growth over Jul-May 2022. The number was close to 55 percent at the beginning of the fiscal year, and has continued to grow steadily, since.
Food group with 10 percent weights is outlined by record sugar production, which was up by 39 percent year-on-year to 7.9 million tons. Textile, with the largest weight of 18 percent, remained subdued with 4 percent year-on-year growth, as the heavyweights, yarn and cloth, both showed a growth of less than 0.5 percent.
The single largest contributor to the overall growth was the newly inducted wearing apparel, which is essentially the quantity of readymade garment exported. The readymade garment export has grown by near 50 percent year-on-year to 50 million dozen pieces, as the dollar value jumped by 30 percent. Whether or not that is a true reflection of LSM activity is for another day, but wearing apparel, with a 6 percent weight, is responsible for nearly 30 percent of the overall LSM growth on new base.
Furniture makes a comeback too, with a 233 percent year-on-year growth, even though the unit value drops by half. Furniture, with a weight of just 0.5 percent in the LSM index, is the third largest contributor growth, behind only apparel and automobiles. Footballs with 0.3 percent weight, are also pulling the weight, as Pakistani footballs proudly make their way to another FIFA World Cup – which usually means an extended run of higher orders beyond the event.
With challenges aplenty, on both domestic and global fronts, the LSM growth stands to face tougher challenges going forward. With the interest rates at multiyear high, energy prices soaring, global growth outlook dwindling – even the revised base, may not come to the rescue of LSM in FY23. The high growth trajectory seems to be coming to an end – much like the previous two times. A slowdown is just around the corner.


Comments
Comments are closed for this article.