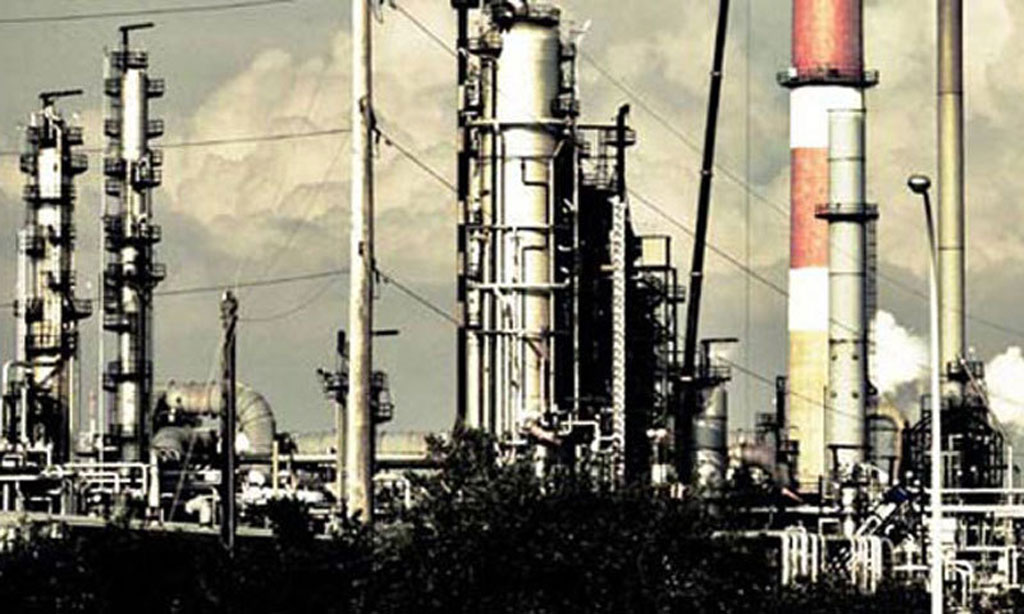
 FY19 wreaked havoc on the downstream oil and gas sector, especially the refining segment where the listed refineries showed staggering losses after tax for the fiscal year. Attock Group, which is the only integrated oil and gas group with booth upstream and downstream oil and gas operations, also saw difficult times in FY19
| Attock Refinery Limited | |||
| Rs(mn) | 1QFY20 | 1QFY19 | YoY |
| Net sales | 36,173 | 44,458 | -19% |
| Cost of sales | 36,430 | 45,080 | -19% |
| Gross profit/(loss) | (257) | (622) | -59% |
| Administrative expenses | 179 | 186 | -4% |
| Distribution costs | 13 | 12 | 8% |
| Other income | 864 | 626 | 38% |
| Operating profit/(loss) | 407 | (194) | |
| Finance cost | 353 | 744 | -53% |
| Profit/(loss) after taxation from refinery opr. | 7 | (727) | |
| Non-refinery income: | 362 | 662 | -45% |
| Profit/(loss) after taxation | 370 | (64) | |
| Earnings per share - basic and diluted (Rs) | |||
| Refinery operations | 0.07 | (6.82) | |
| Non-refinery operations | 3.40 | 6.21 | |
| 3.47 | (0.61) | ||
| Gross margin | -0.71% | -1.40% | |
| Net margin | 1.02% | -0.15% | |
| Source: PSX | |||
Both its refineries National Refinery Limited (PSX: NRL) and Attock Refinery Limited (PSX: ATRL) had abysmal financial performance during the year. Where ATRL saw its earnings nosediving from a profit of Rs579 million in FY18 to a loss of over Rs5 billion in FY19, NRL posted a loss of over Rs8.5 billion in FY19 versus a profit of Rs1.77 billion in FY18! The catalyst to the recent downgrade in profitability has been the phasing out of furnace oil as the refineries initially were unable to clear stocks, suffering from inventory losses and then later had no option but to lower petroleum refining due to lower furnace oil demand as well as age old refining process that inhibited operations.
| National Refinery Limited | |||
| Rs(mn) | 1QFY20 | 1QFY19 | YoY |
| Net sales | 39,268 | 41,259 | -5% |
| Cost of sales | 39,456 | 41,781 | -6% |
| Gross profit | (188) | (521) | -64% |
| Distribution and marketing expenses | 197 | 191 | 3% |
| Administrative expenses | 234 | 227 | 3% |
| Other operating income | 102 | 90 | 13% |
| Other operating expenses | 5 | 4 | 22% |
| Operating profit | (523) | (853) | -39% |
| Finance cost | 371 | 468 | -21% |
| Profit after taxation | (679) | (1,066) | -36% |
| (LPS)/EPS (Rs/share) | (8.49) | (13.33) | -36% |
| Gross margin | -0.48% | -1.26% | |
| Net margin | -1.73% | -2.58% | |
| Source: PSX | |||
While it might be too early to comment on how the refining segment would perform in FY20, there have been some streaks of improvement in ATRL's and NRL's financial performance in 1QFY20. ATRL has posted a profit after tax of Rs370 million versus a loss after tax of Rs64 million in 1QFY19, whereas NRL that continues to stay in the loss zone with losses of over Rs670 million, but the loss after tax is seen coming down by 36 percent year-on-year in 1QFY20. However, improvement in financial performance has not come from improving revenues, but a decline in exchange losses as portrayed by declining finance costs of the two refineries, which means that demand scenario is still the same: weak.
If the news reports are to be believed, the refining segment in the country is gearing up for some major overhaul with around six new refineries in the works. Such likely competitive environment should force the existing players to pick up their act and upgrade and work towards deep conversion refineries to remain relevant.
They should avail the 5-year window incentive given by the government along with other concessions in machinery and equipment import to upgrade. Simply banking on non-refinery operations to bail out (as in the case of ATRL) and pinning all hopes to the improvement in the lube segment (NRL is a lube refinery) would not cut it.


Comments
Comments are closed.