


MCB is one of the pioneers of the banking sector of Pakistan. The bank was incorporated in the private sector in 1947, however, in 1974, it was nationalized. The bank was later privatized in 1991. MCB is the first Pakistani bank that got its global deposit receipts (GDRs) listed on London Stock Exchange in 2006. It is also the first Pakistan bank to incorporate a wholly owned Islamic subsidiary.
The bank enjoys a huge geographical reach with over 1400 branches and over 1480 ATMs across Pakistan with a customer base of over 8 million. This is coupled with a significant footprint in UAE, Bahrain and Srilanka. This makes MCB the 2nd largest bank of Pakistan after HBL in terms of branch network. In terms of assets, MCB holds the 4th slot in the banking sector.
Pattern of Shareholding

As of December 31, 2022, MCB has the total outstanding share capital of 1.2 billion shares which are held by 56,484 shareholders. The major shareholders of the bank are its Associated Companies, Undertakings and Related Parties holding 20.29 percent of the shares. Among the Associated Companies, Nishat Mills Limited and Adamjee Insurance Company Limited enjoy the major chunk. This is followed Maybank International Trust holding 18.78 percent of MCB’s outstanding capital. Local General Public have a share of 15.14 percent followed by the Directors, Chief Executives, their spouses and minor children holding 13.25 percent of MCB’s shareholding. Insurance Companies enjoy 8.68 percent of the MCB’s outstanding capital while Banks, DFIs and NBFIs account for 2.89 percent shares of MCB. The remaining shares are held by other categories of shareholders.
Historical Performance (2018-22)
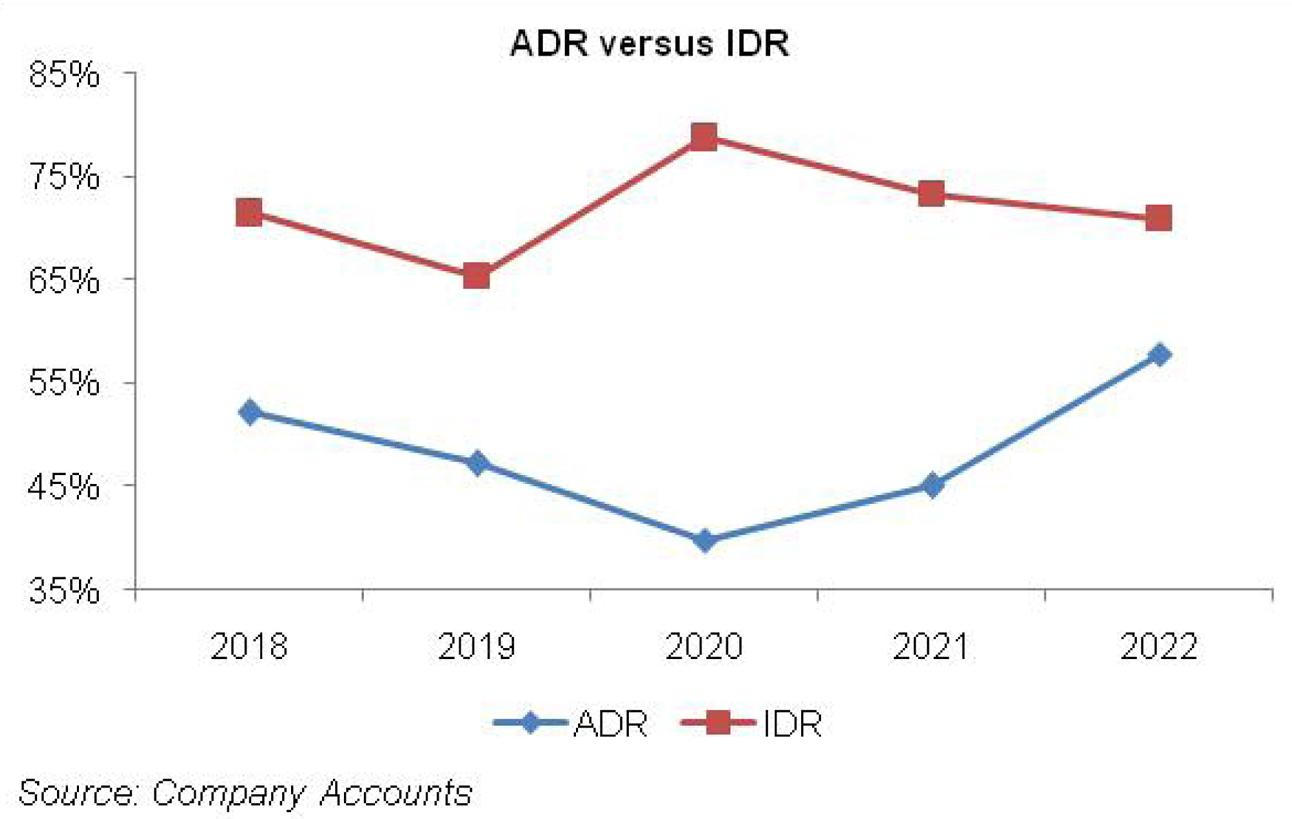
MCB’s asset base which had posted a marginal 1 percent year-on-year growth in 2019 gained momentum in the subsequent two years where it grew by 16 percent and 12 percent respectively. In 2022, the pace of growth again leveled down and stood at 6 percent. While advances grew by 25 percent year-on-year in 2022, the bank streamlined its investment portfolio which slid by 5 percent year-on-year during the year. This took MCB’s ADR to 57.85 percent – the highest among all the years under consideration. It is pertinent to note that the bank’s advances had been inching down in 2019 and 2020;consequently, its ADR tapered off from 52.12 percent in 2018 to 39.83 percent in 2020. However, the advances took an upward flight in 2021 and the pace continued in 2022 with 24 percent and 25 percent year-on-year growth respectively.
Conversely, MCB’s investments which slightly dropped by 0.1 percent in 2019 boasted a staggering year-on-year growth of 36 percent in 2020. These were the times when the economy was hit hard by COVID-19 which put brakes on the business activity due to lockdown and hence private sector borrowings came to a standstill. The bank played well by parking excessive volume of its funds in government securities in 2020. This took MCB’s IDR from 71.43 percent in 2018 to 78.78 percent in 2020. However, in the subsequent years, the bank seems to be more inclined towards its core duty of lending to the private sector as its investment grew by only 2 percent in 2021 and then nosedived by 5 percent in 2022 while pushing down its total asset base. MCB’s IDR settled at 70.99 percent in 2022.

Connecting the dots, in 2019 and 2020 where MCB’s advances had been plunging, its non-performing loans were growing.This took its Infection ratio from 8.95 percent in 2018 to 9.97 percent in 2020. MCB’s non-performing loans shrank in 2021 with infection ratio moving down to 7.94 percent. In 2022, while the non-performing loans grew by 2 percent year-on-year to clock in at Rs.51,260 million, considerable rise in the advances portfolio during the year translated into an Infection ratio of 6.43 percent – the lowest since 2018. MCB maintains an adequate coverage against its non-performing loans. Its coverage ratio which stood at an enormous 98.87 percent in 2020 narrowed down to 86.17 percent in 2022 as comparatively lower amount of NPLs was classified in the loss category. However, an alarming fact is that over 95.78 percent of MCB’s NPLs are still classified in the loss category as of December 31, 2022.

Delving into further details of the advances portfolio of MCB shows that around 16.46 percent of its advances pertain to textile sector, followed by transportation and storage (10.84 percent) and food and beverages (7.96 percent). Conversely, wholesale and retail traders top the list when it comes to non-performing loans, contributing 28.83 percent in its MCB’s total non-performing loans. This is followed by textiles (23.76 percent) and sugar (8.26 percent).

On the liabilities front, the deposit base of the bank which had been growing reasonably until 2021 took a 2 percent year-on-year dive in 2022. While low deposit mobilization seems an unpleasant scenario, however, digging the books show that the drop in deposits was on account of a 44 percent year-on-year decline in its term deposits and 12 percent decline in its saving deposits. Conversely, current deposits grew by 20 percent year-on-year in 2022. MCB’s CASA ratio grew from 91.02 percent in 2018 to 95.93 percent in 2022 – the highest ever CASA posted by the bank. MCB’s CASA is also much higher than its peer group. While the concentration of saving deposits in the overall deposit mix conveniently stays above the current deposits in all the years, it has considerably reduced from its peak level of 57.1 percent in 2020 to 49.4 percent in 2022. On the other hand, the share of current deposits in MCB’s overall deposits has grown to 46.5 percent in 2022 versus 35.3 percent in 2018.
An analysis of MCB’s financial performance over the years shows that its topline plummeted in 2020 and 2021 which was the result of curtailed volume of private sector advances and monetary easing scenario respectively. However, its net interest income (NII) only nosedived in 2021. MCB’s topline posted a staggering 63 percent year-on-year growth in 2022 on account of a sizeable growth in advances coupled with favorable yield curve movement. This coupled with an enhanced focus on current deposits culminated into a 36 percent year-on-year spike in MCB’s NII in 2022.

MCB’s non-markup income which dropped by 3 percent year-on-year in 2019 on account of lesser gain on securities and foreign exchange gain has never looked back ever since. 2022 saw the highest year-on-year growth of 23 percent in MCB’s non-markup income. While fee and commission income continues to be the biggest contributor in the non-markup income over the years, foreign exchange income proved to be the star performer in 2022 with 145 percent rise on the back of unrelenting depreciation of local currency. The performance of debit cards, trade business and home remittances also remained robust in 2022, however, the bank incurred a loss of Rs.1464 million in securities (shares and units to be specific) in 2022 which diluted the overall growth of non-markup income in 2022. The share of non-markup income to total income has contracted from 27.21 percent in 2018 to 22.02 percent in 2022.
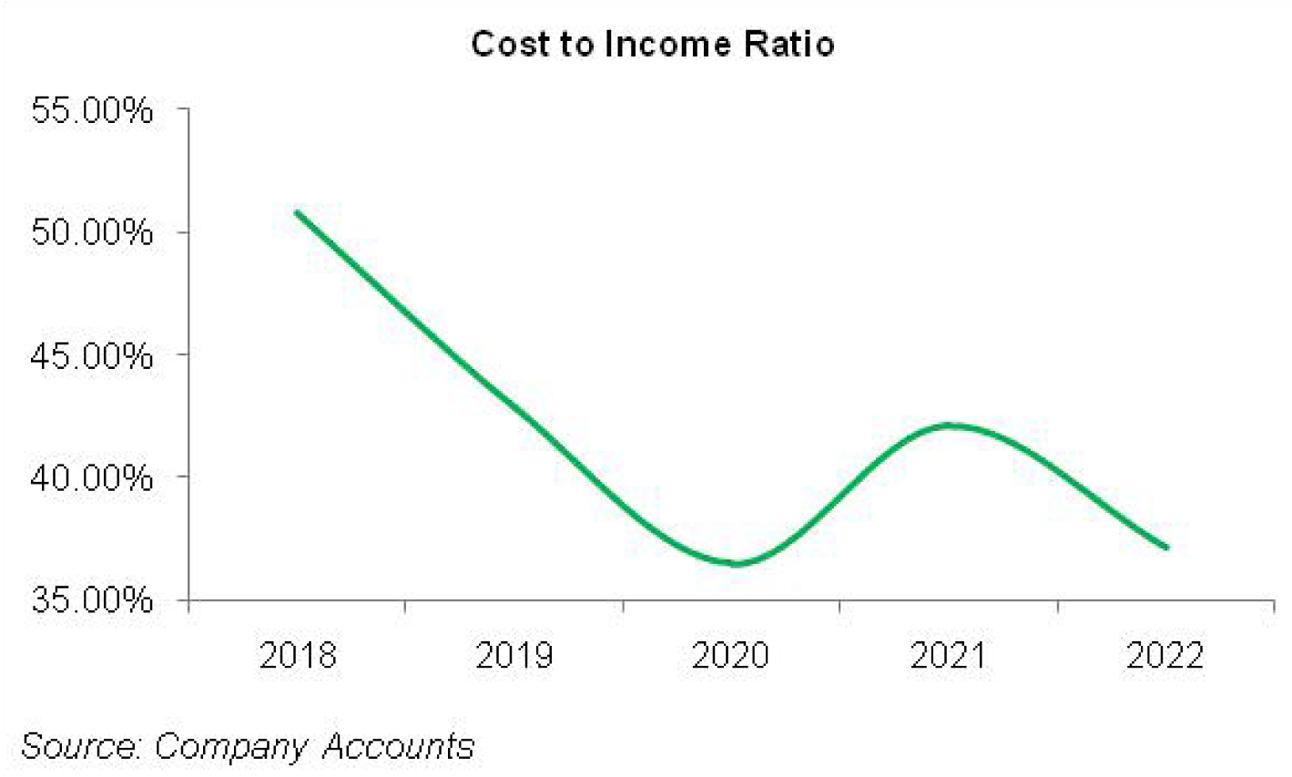
Non-markup expense which had been posting a single digit growth until 2021, posted a 17 percent year-on-year growth in 2022. MCB’s branch network grew from 1387 branches in 2018 to 1448 branches in 2022 with number of employees growing from 12,880 in 2018 to 14,341 in 2022. However, the bank was able to streamline its cost-to-income ratio from 50.77 percent in 2018 to 37.13 percent in 2022.
Since 2018, MCB has booked provisions in 2019 and 2020 as against reversals in the remaining years which speaks volumes of the improved credit profile. Profit before tax has followed a growth trajectory in all the years under consideration with the highest year-on-year growth of 37 percent seen in 2022. However, increase in tax on income from 35 percent in 2021 to 39 percent in 2022 coupled with an imposition of 10 percent super tax in 2022 as against 4 percent in 2021 dampened the bottomline growth to 6 percent in 2022. Profit after tax clocked in at Rs.32,741 million in 2022 with an EPS of Rs.27.63 as against Rs.26 in 2021.
Recent Performance (1HCY23)
During 1HCY23, MCB’s markup income posted a tremendous rise of 70 percent year-on-year which came on the back of a 17 percent year-on-year growth in the bank’s investments while its advances slumped by 19 percent year-on-year in 1HCY23. While in the past two years, the bank had become more focused towards private sector lending, with its ADR ticking up since 2021, the lack of borrowing appetite from the private sector amidst lackluster economic activity could be blamed for a slide in advances during 1HCY23.
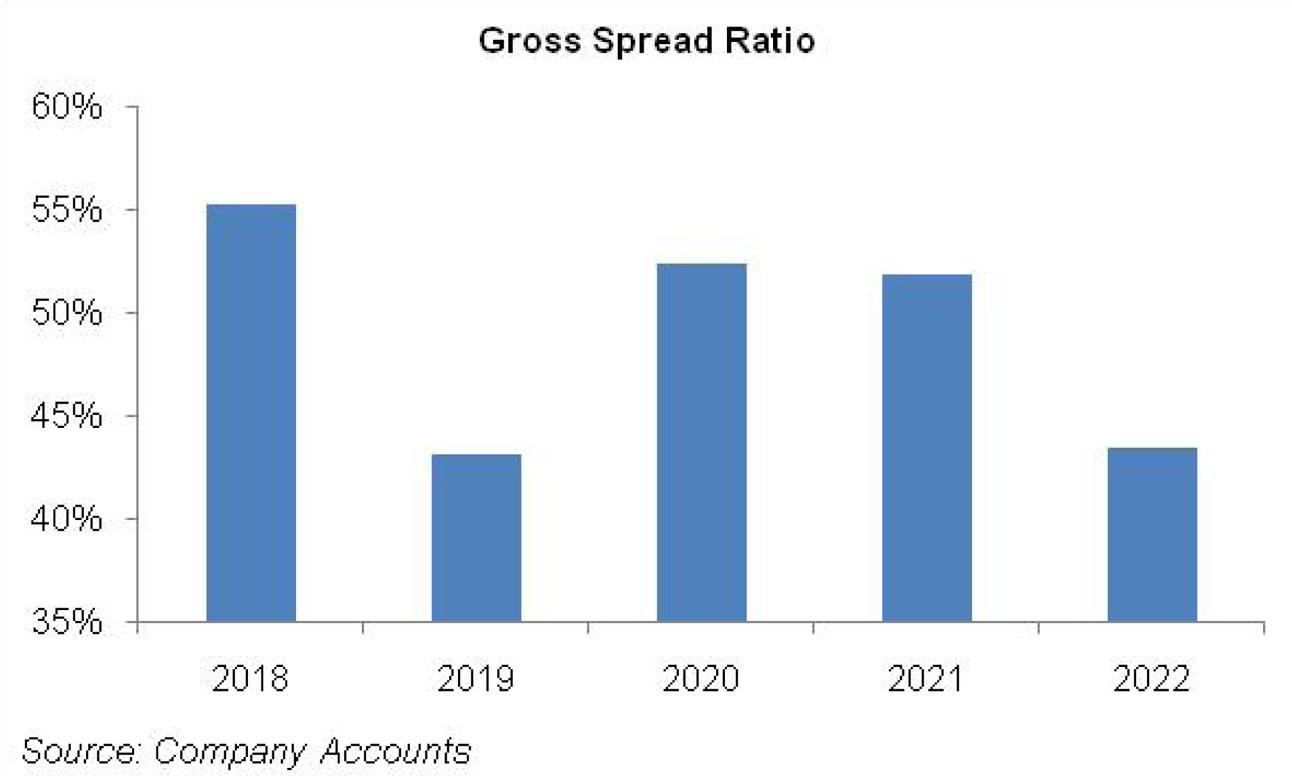
Markup expense grew by 69 percent year-on-year in 1HCY23 on account of increased focus towards non-remunerative deposit mobilization. Current account deposits grew by 32 percent year-on-year in 1HCY23 taking its contribution in the total deposit mix to over 52 percent in 1HCY23. This culminated into a 72 percent rise in MCB’s NII during 1HCY23 with its gross spread ratio improving from 45.65 percent in 1HCY22 to 46.12 percent during 1HCY23.
Non-markup income grew by 9 percent year-on-year in 1HCY23. While fee and commission income posted a staggering 31 percent hike during the period, it was watered down by a 13 percent drop in foreign exchange income and 89 percent drop in gain on securities. Non-markup income to total income shrank from 24.86 percent in 1HCY22 to 17.35 percent in 1HCY23. Non-markup expenses grew by 26 percent year-on-year in 1HCY23, mainly contributed by operating expenses. Despite unabated inflation, MCB was able to rein in its expensive and drive down its cost to income ratio from 37.46 percent in 1HCY22 to 29.58 percent in 1HCY23.
MCB booked provision worth Rs.1911.76 million in 1HCY23 as against the reversal of Rs.802.10 million during the same period last year. While there is a lack of clarity on this front, this might be because of a spike in NPLs during 1HCY23 or because more NPLs would be classified in the loss category during the period. However, MCB would have adequately provided for its NPLs.
The bottomline grew by 140 percent year-on-year during 1HCY23 to clock in at Rs.26,687 million with an EPS of Rs. 22.52 versus Rs.9.39 during 1HCY22. The earnings were however dampened by higher effective tax rate.
Future Outlook

With caretaker government soon to takeover, industry insiders expect the local currency to further weaken. This coupled with the hike in the prices of fuel and electricity, edibles, oil, grains and other commodities will fuel further spike in inflation. With inflation not expected to tame down anytime soon, discount rate seems to show no breather either. This would be beneficial for the banking sector which is already raking in huge profits on the back of staggering net markup income and foreign exchange gains.


Comments
Comments are closed for this article.