


Century Paper & Board Mills Limited (CEBP) was incorporated in Pakistan as a public limited company in 1984 and began its commercial operations in 1990. The principal activity of the company is the manufacturing of paper, board and related products. The company is a part of Lakson Group of Companies. Besides catering to the needs of local market, CEPB’s products are competing well in the international market. The company also entered into corrugated cartons manufacturing business in 2003.
Pattern of Shareholding
As of June 30, 2022, CEPB has a total of 202.885 million shares outstanding which are held by 3481 shareholders. Associated companies, undertakings and related parties are the major shareholders of CEPB with a stake of 68.66 percent in the company. This is followed by General Public holding 13.42 percent shares of CEPB. Around 4.44 percent of the company’s shares are held by Modarabas and Mutual Funds while Banks, DFIs and NBFIs account for 3.42 percent of the outstanding shares of CEPB. Insurance companies and NIT and ICP hold 2.76 and 2.67 percent shares of the company respectively. The remaining shares are held by other categories of shareholders.
Historical Performance (2018-22)
CEPB’s topline has been posting steady growth in all the years under consideration, however, its bottomline slid twice - in 2019 and 2022. The margins, after ticking down in 2019, posted an uptick in 2020 and 2021 but tumbled in 2022. The detailed performance overview of each of the years under consideration is given below:
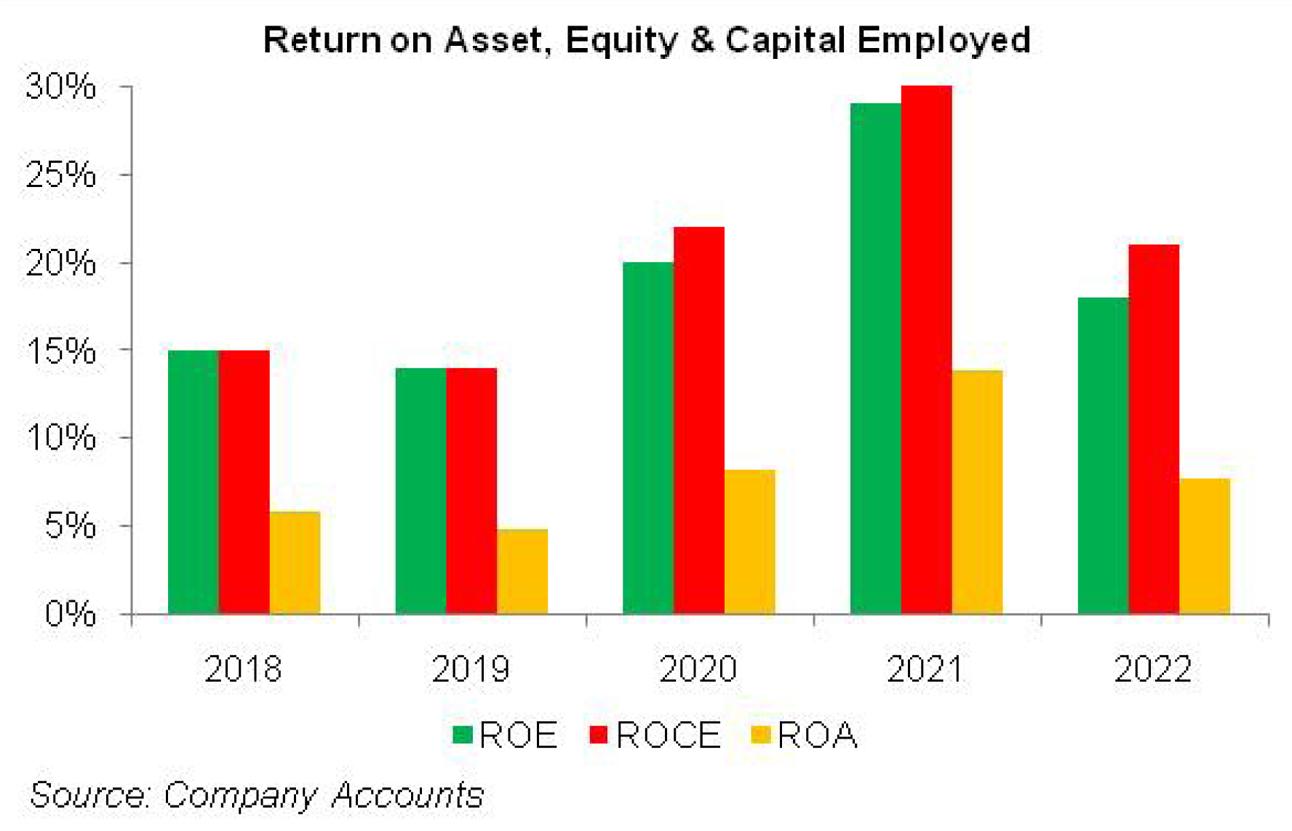
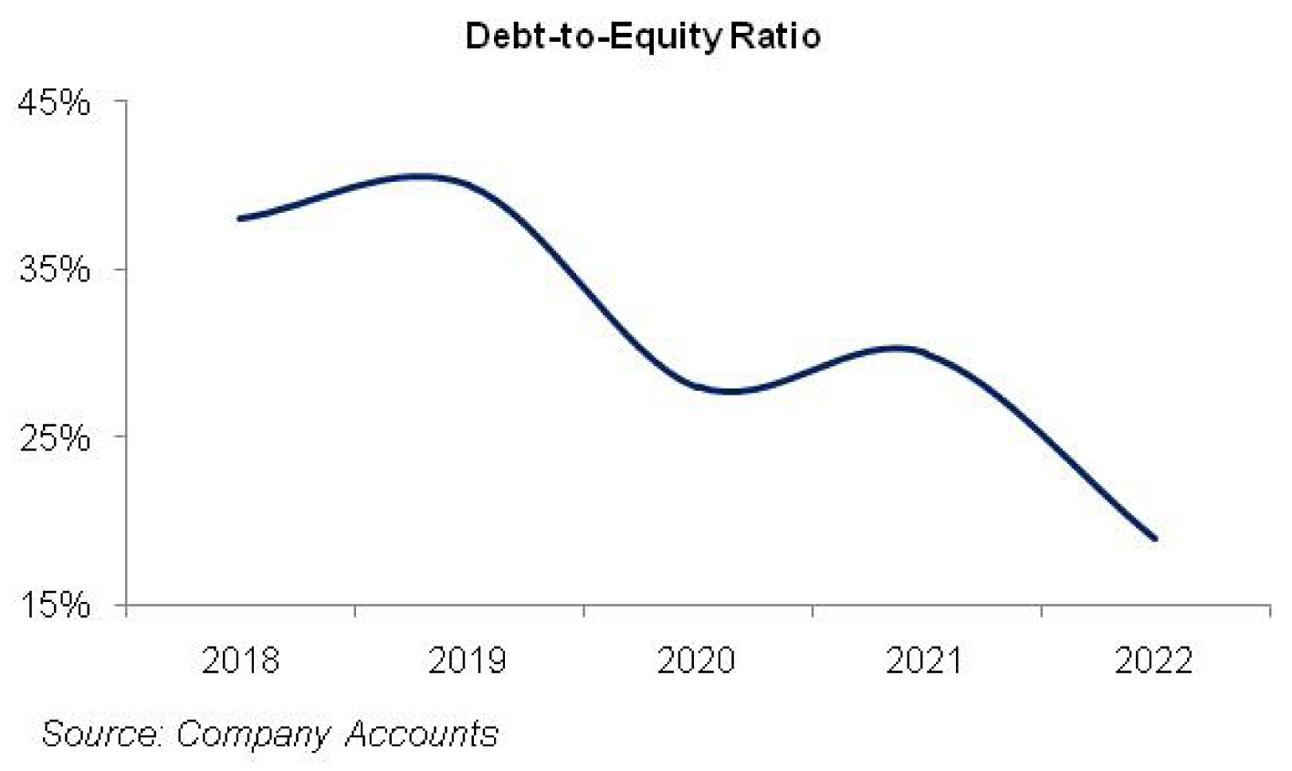
In 2019, CEPB’s topline grew by 17 percent year-on-year which came on the back of improved prices, better sales mix coupled with an increase in sales volume from 214,347 MT in 2018 to 216,771 MT in 2019. The company’s capacity utilization stood at 95 percent in 2019. The cost of sales grew by 19 percent year-on-year in 2019 on the back of Pak Rupee depreciation and fuel price hike. Gross profit ticked up by 6 percent year-on-year in 2019; however, GP margin dropped from 13.2 percent in 2018 to 12 percent in 2019. Administrative expense grew by 11 percent year-on-year in 2019 due to increase in payroll expense on account of inflation as well as increase in employee headcount during the year. High freight also pushed up the selling and distribution expense by 19 percent year-on-year in 2019. Lower WPPF and legal and professional charges resulted in a 7 percent year-on-year drop in other expense. Other income grew by 23 percent year-on-year on account of higher proceeds from scrap sales. Operating profit grew by 6 percent year-on-year in 2019; however, OP margin slid from 10 percent in 2018 to 9 percent in 2019. The greatest dent to the bottomline came on the back of a 66 percent year-on-year rise in finance cost. During the year, the company redeemed its preferred stock worth Rs. 901 million and replaced it with loans from sponsors. This drove up the debt-to-equity ratio from 38 percent in 2018 to 40 percent in 2019. Higher debt coupled with monetary tightening culminated into a higher financial cost for the year and pushed down the bottomline by 11 percent year-on-year to clock in at Rs.884.154 million in 2019. NP margin shrank from 5.23 percent in 2018 to 4 percent in 2019. EPS also dropped from Rs. 6.25 in 2018 to Rs.5.80 in 2019.
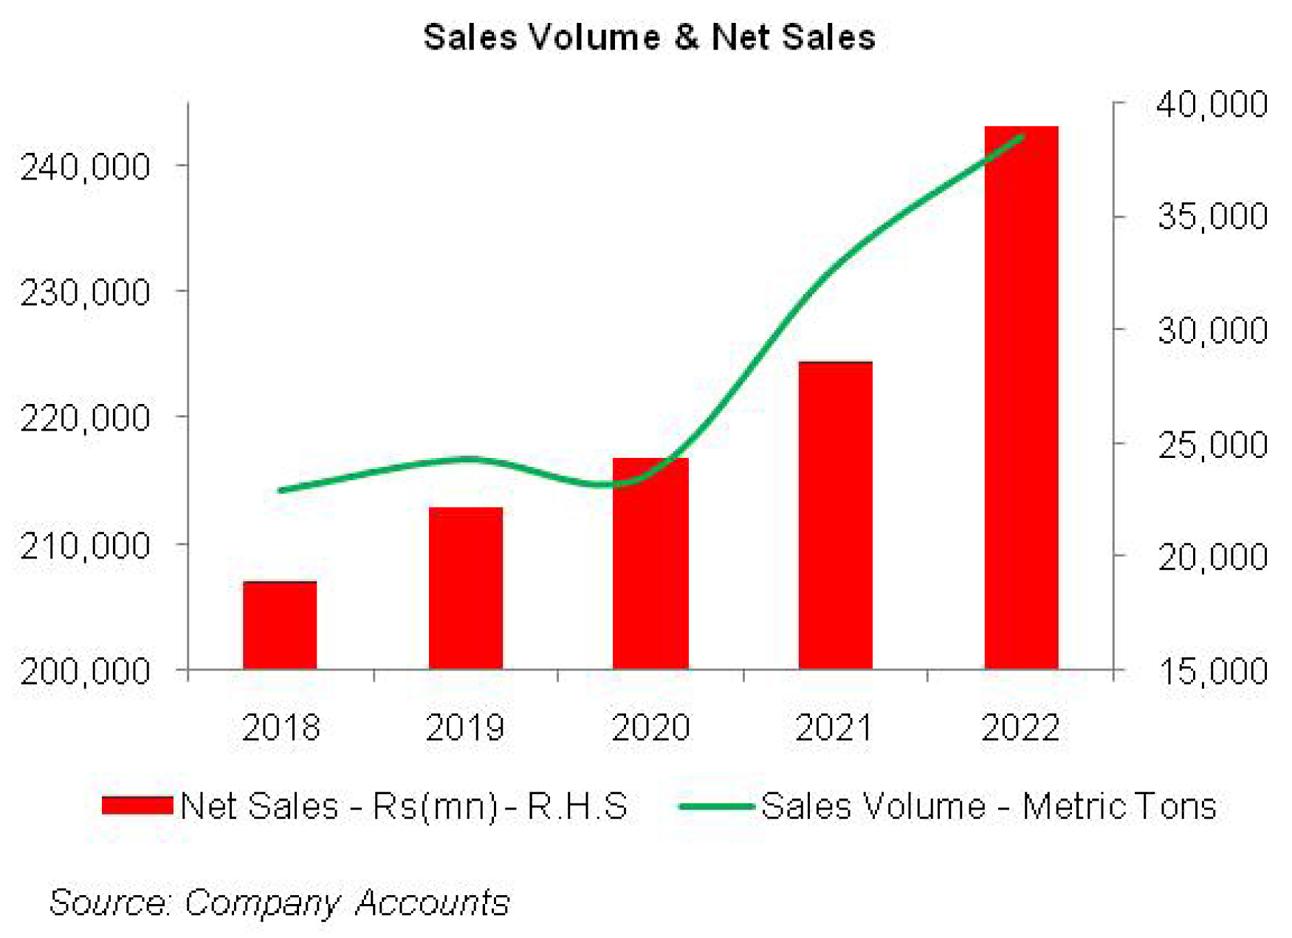
2020 mustered a marginal 9 percent year-on-year growth in CEPB’s topline as the sales volume tapered off to 215,648 MT, down by 0.5 percent year-on-year. The outbreak of COVID-19 in the last quarter of 2020 suppressed the consumer demand which posted improvement in the initial quarters of 2020. During 2020, the company tapped export markets in Afghanistan and Middle East which gave much support to its topline. Cost of sales grew by 4 percent year-on-year while gross profit posted an encouraging growth of 48 percent year-on-year on the back of improved sales mix and better prices. GP margin rose to 16.2 percent in 2020. Administrative and distribution expense climbed up by 13 percent and 12 percent year-on-year respectively in 2020. The major growth drivers were high payroll expense and higher outward freight in 2020. The payroll expense grew despite the fact that the number of employees dropped from 1652 in 2019 to 1640 in 2020. Higher WWF and WPPF translated into a 50 percent year-on-year rise in other expense. Other income also multiplied by 12 percent year-on-year on the back of higher scrap sales. Operating profit magnified by 57 percent year-on-year in 2020 with OP margin jumping up to 12.9 percent. The company tried to rationalize its borrowing cost during 2020 by using FE-25 and offshore borrowings at low rate along with streamlining its short-term borrowings. Its debt-to-equity ratio also dropped to 28 percent in 2020. However, high interest rates for most of the year pushed the finance cost up by 30 percent year-on-year in 2020. The bottomline grew by 72 percent year-on-year in 2020 to clock in at Rs.1521.772 million with an NP margin of 6.25 percent. EPS also grew to Rs.10.35 in 2020.
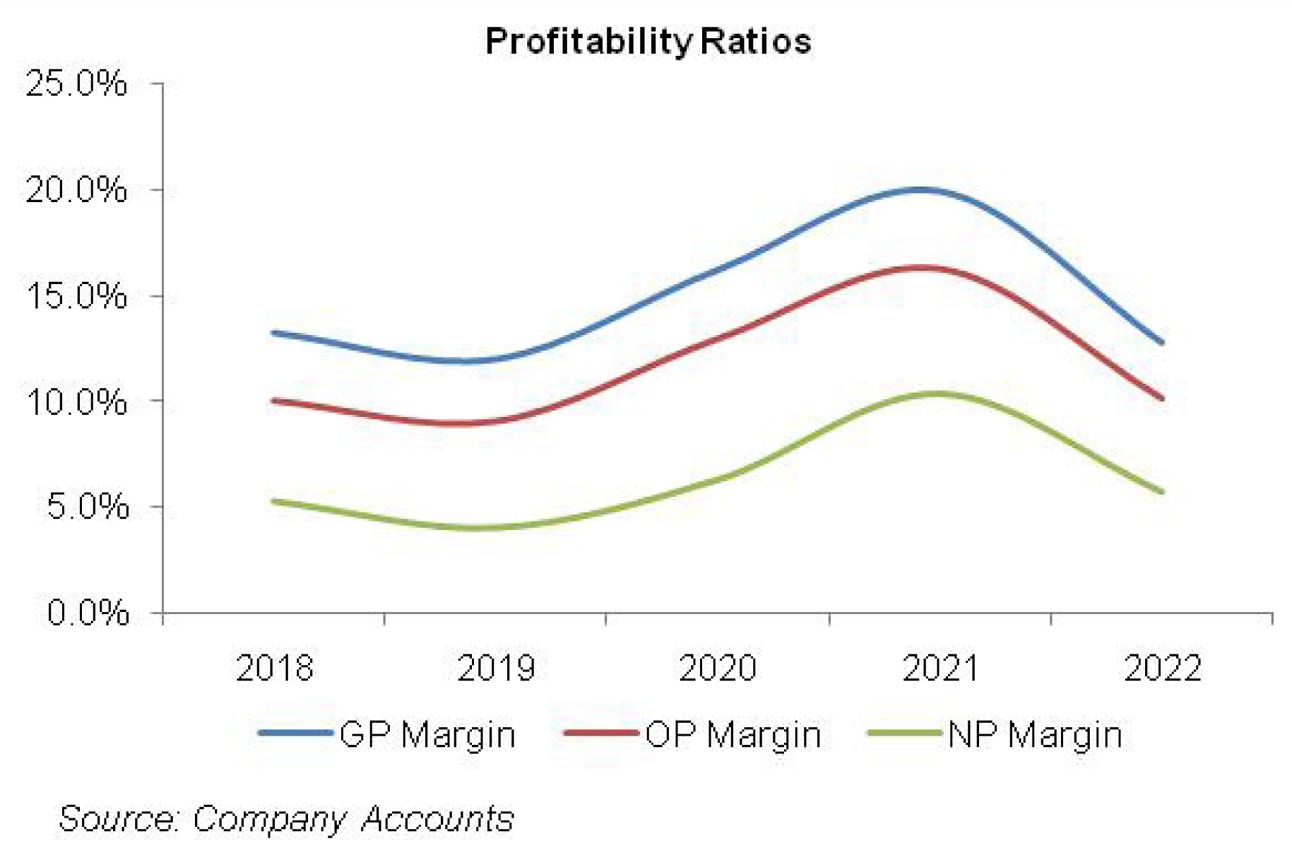
In 2021, net sales grew by 18 percent year-on-year on the back of an 8 percent year-on-year rise in sales volume. CEPB’s sales volume stood at 232,051 MT in 2021 as consumers started focusing towards packaged products and online shopping after COVID-19 which increased the demand of packaging products in 2021. However, the demand of writing/printing papers significantly dropped in 2021 due to recurring lockdown. CEPB’s export sales also almost doubled in 2021. Gross profit grew by 45 percent year-on-year in 2021 due to operational efficiency, optimal sourcing of raw material and low fuel cost in 2021. GP margin also tremendously grew to 19.9 percent in 2021. Administrative and distribution expense rose by 11 percent and 23 percent respectively in 2021. Other expense staggeringly grew by 122 percent year-on-year in 2021 on account of higher WWF, WPPF and also because of provision booked for expected credit losses in 2021. Other income also posted a handsome 77 percent year-on-year growth not only from scrap sales proceeds but also because of gain on extinguishment of GIDC liability, gain on insurance claims, government grants as well as gain on sale of operating fixed assets in 2021. Operating profit grew by 48 percent year-on-year in 2021 with OP margin climbing up to 16.2 percent. Finance cost shrank by 59 percent year-on-year in 2021 on the back of low discount rate. The bottomline posted a stunning 94 percent year-on-year growth in 2021 to clock in at Rs.2959.66 million with an NP margin of 10.3 percent. EPS grew to Rs.14.59 in 2021.

2022 brought 4.4 percent year-on-year growth in CEPB’s sales volume due to impressive growth posted by LSM which created demand for paper and paperboard products. This culminated into a topline growth of 36 percent year-on-year in 2022. While local market performed exceptionally well in terms of sales, export sales dropped by 71 percent year-on-year in 2022 to clock in at just Rs. 41 million which includes sales to Afghanistan. However, high commodity prices due to commodity super cycle in the international market on the back of Russia-Ukraine crisis as well as Pak Rupee depreciation and indigenous inflation jacked the cost of sales up by 48 percent year-on-year. This trimmed down the gross profit by 13 percent year-on-year in 2022 with GP margin sliding down to 12.8 percent. Administrative and distribution expenses posted 18 percent and 14 percent year-on-year growth respectively on the back of inflation, induction of human resources to cater high demand and also because of higher outward freight. Other expense slipped by 33 percent year-on-year while other income posted a marginal 3 percent year-on-year growth in 2022. This trimmed down the operating profit by 15 percent year-on-year while OP margin climbed down to 10.1 percent in 2022. Finance cost posted a significant growth of 67 percent in 2022 due to high discount rate coupled with high working capital requirements which drove up the short-term borrowings. Due to supply chain shocks on the back of Russia-Ukraine crisis, the company maintained excess stock of imported inventory which required excess funds. Moreover, the company also borrowed under TERF facility to finance its Balancing, Modernization & Replacement (BMR) projects. Net profit dropped by 25 percent year-on-year in 2022 to clock in at Rs.2211.921 million with an NP margin of 5.7 percent. EPS also nosedived to Rs.10.9 in 2022.
Recent Performance (9MFY23)
During 9MFY23, CEPB’s topline posted a 34 percent year-on-year growth. Sales volume dropped by 8 percent year-on-year to 170,646 MT in 9MFY23. To cope up with the supply side constraints on the back of import restrictions and also due to shutdown of machine to facilitate BMR projects, CEPB rationalized its sales mix to include the products with competitive prices to cover up the constant increase in cost of raw materials and fuel. Yet, CEPB failed to drive up its gross profit in 9MFY23. CEPB’s gross profit declined by 11 percent year-on-year in 9MFY23 with GP margin climbing down from 13.2 percent in 9MFY22 to 8.7 percent in 9MFY23. Administrative and distribution expense posted a year-on-year growth of 24 percent and 23 percent respectively in 9MFY23. Due to lower profitability in 9MFY23 vis-à-vis last year, the company booked lesser provision for WWF and WPPF which drove down the other expense by 53 percent year-on-year in 9MFY23. Other income grew by 71 percent year-on-year in 9MFY23 primarily on account scrap sales and government grant. Operating profit shriveled by 13 percent year-on-year in 9MFY23 with OP margin diving to 6.8 percent down from 10.5 percent during the same period last year. Finance cost multiplied by a massive 239.5 percent year-on-year in 9MFY23 due to combined effect of higher discount rate, high working capital requirements and high long-term borrowings to finance BMR projects. The result was a bottomline slide of 59 percent year-on-year in 9MFY23. Net profit clocked in at Rs.738.068 million in 9MFY23 with an NP margin of 1.93 percent versus 6.3 percent during the same period last year. EPS also dropped from Rs.8.04 in 9MFY22 to Rs.3.31 in 9MFY23.
Future Outlook
High inflation has restrained the purchasing power of consumers which in turn has put a dent on the demand of paper and paperboard products which are widely used for packaging consumer products. Moreover, global recession has lowered the prices of similar products in the international market which is enticing the local FMCG companies to import the packaging material from the international market. Owing to import restrictions and Pak Rupee depreciation, some FMCG companies are even shifting to cheaper local alternatives, further suppressing the demand of CEPB products.
Lately, the company also suffered supply chain barriers due to import restrictions which created shortage of raw materials for the company while local raw materials were also increasing on account of high inflation. This pushed the company to streamline its existing sales mix and include only profitable products to avoid the freefall of its margins.
With the approval of SLA agreement with IMF, the restriction on imports has been removed. This, on one hand, will pave the way for CEPB to import raw materials, while on the other hand enable the FMCG companies to import paper and paper products from the global market. Let’s see how CEPB attracts its customers through cost rationalization and operational efficiency as its ongoing BMR projects will be operational from the upcoming financial year.


Comments
Comments are closed for this article.