AIRLINK 69.20 Decreased By ▼ -3.86 (-5.28%)
BOP 4.90 Decreased By ▼ -0.19 (-3.73%)
CNERGY 4.26 Decreased By ▼ -0.11 (-2.52%)
DFML 31.25 Decreased By ▼ -1.20 (-3.7%)
DGKC 77.25 Increased By ▲ 1.76 (2.33%)
FCCL 20.00 Increased By ▲ 0.48 (2.46%)
FFBL 35.00 Decreased By ▼ -1.15 (-3.18%)
FFL 9.12 Decreased By ▼ -0.10 (-1.08%)
GGL 9.80 Decreased By ▼ -0.05 (-0.51%)
HBL 112.76 Decreased By ▼ -3.94 (-3.38%)
HUBC 133.04 Increased By ▲ 0.35 (0.26%)
HUMNL 6.95 Decreased By ▼ -0.15 (-2.11%)
KEL 4.23 Decreased By ▼ -0.18 (-4.08%)
KOSM 4.25 Decreased By ▼ -0.15 (-3.41%)
MLCF 36.60 Increased By ▲ 0.40 (1.1%)
OGDC 132.87 Decreased By ▼ -0.63 (-0.47%)
PAEL 22.64 Increased By ▲ 0.04 (0.18%)
PIAA 24.20 Decreased By ▼ -1.81 (-6.96%)
PIBTL 6.46 Decreased By ▼ -0.09 (-1.37%)
PPL 116.30 Increased By ▲ 0.99 (0.86%)
PRL 25.90 Decreased By ▼ -0.73 (-2.74%)
PTC 13.08 Decreased By ▼ -1.02 (-7.23%)
SEARL 52.00 Decreased By ▼ -1.45 (-2.71%)
SNGP 67.60 Increased By ▲ 0.35 (0.52%)
SSGC 10.54 Decreased By ▼ -0.16 (-1.5%)
TELE 8.28 Decreased By ▼ -0.14 (-1.66%)
TPLP 10.80 Increased By ▲ 0.05 (0.47%)
TRG 59.29 Decreased By ▼ -4.58 (-7.17%)
UNITY 25.13 Increased By ▲ 0.01 (0.04%)
WTL 1.27 No Change ▼ 0.00 (0%)
BR100 7,409 Decreased By -52.4 (-0.7%)
BR30 24,036 Decreased By -134.9 (-0.56%)
KSE100 70,667 Decreased By -435.6 (-0.61%)
KSE30 23,224 Decreased By -170.8 (-0.73%)
Markets

US oil may test resistance at $54.19

  • Wave pattern suggests the progress of a wave 5, which may travel into $55.02-$56.37 range, based on the depth of the wave 4.
Published January 15, 2021

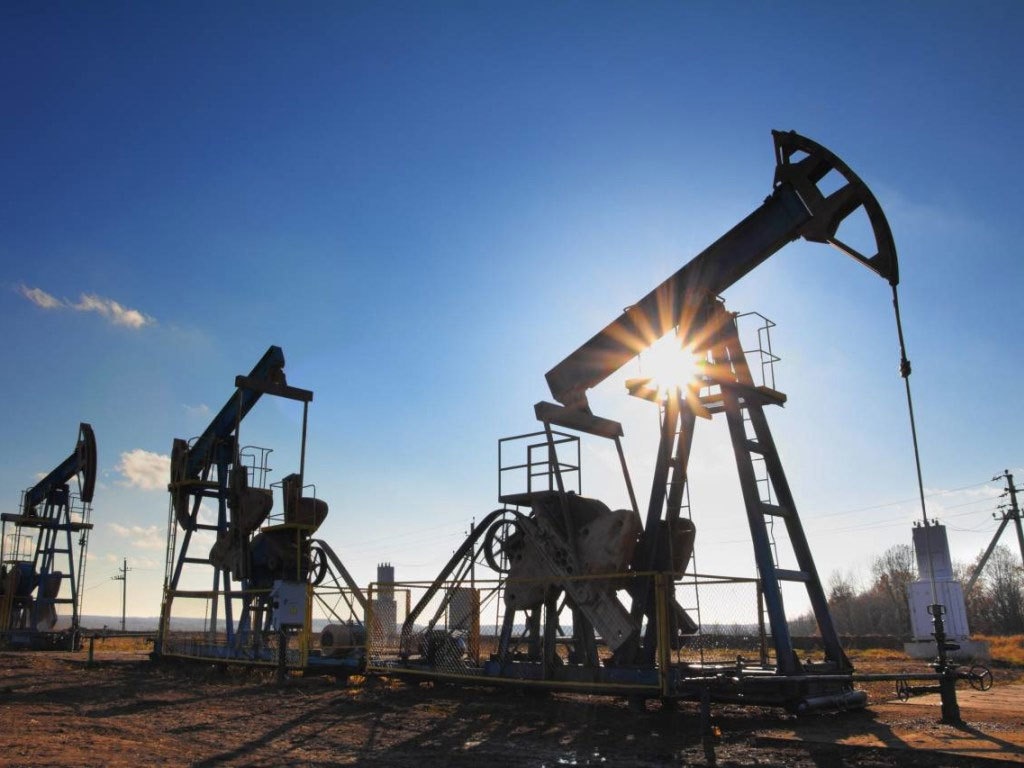
SINGAPORE: US oil may test a resistance at $54.19 per barrel, a break above which could lead to a gain to $55.02.

The correction from the Jan. 13 high of $53.93 may have completed, as it has almost been reversed. The reversal signals a continuation of the uptrend.

Wave pattern suggests the progress of a wave 5, which may travel into $55.02-$56.37 range, based on the depth of the wave 4.

Support is at $53.41, a break below which could cause a fall into $52.01-$52.84 range. On the daily chart, the uptrend is developing within a rising channel, which defines a price band of $52.84-$56.37.

The trend looks steady and shows no sign of a reversal. The sideways move around $52.84 over the past two days could be a preparation for a stronger rally.

Each reader should consult his or her own professional or other advisers for business, financial or legal advice regarding the products mentioned in the analyses.

Comments

Comments are closed.