
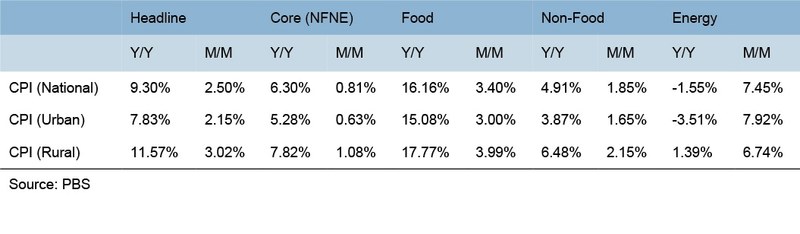
The headline inflation stood at 9.3 percent in Jul-20. The monthly index is up by 2.5 percent. This is the highest monthly increase since Sep-10 – a ten year high. This is higher than industry estimates. It will significantly dilute the impact of high base effect in the first half of last fiscal year. The main reasons for high inflation in July are increase in perishable food items, petrol and diesel prices, and quarterly adjustment of house rent index.
The food items are the main culprit once again. Prices of tomatoes increased by 180 percent in a month followed by vegetables at 23.8 percent. These are cyclical and will reverse in due course of time. But there are no signs yet. SPI readings in the last two weeks suggest that food inflation in August would be higher too. The worrisome factor is the increase in the prices for non-perishable items where numbers are not that high but increase in wheat prices will have a long-lasting impact. Recent SPI numbers suggest that milk prices are going up too. Milk is a heavy weight in CPI – almost one fourth of food basket is milk and dairy products. Rise in milk and wheat prices is to cascade into virtually all the processed food products – directly or indirectly through feed stock.
The second biggest contributor to the CPI is the transport sector where motor fuel prices went up by 27 percent. This was because of lower prices in June and higher petroleum levy. There will be a marginal increase in this segment in August too. Nonetheless, overall international oil prices are on the lower side and this will be beneficial on the external front by lowering the value of petroleum imports and on the fiscal side through higher tax collection.
The third element is the quarterly adjustments in house rent. This is one fifth of the CPI basket and the survey is conducted once in three months. The house rent index increased by 1.58 percent in urban and 1.7 percent in rural from the last recording in Apr-20. The number is slightly higher than market expectations which has fueled the hike in July inflation.
The intriguing fact is that the gap between the rural and urban inflation is widening with higher incidence of price increases observed in the rural economy. Since the weight of food is higher in the rural basket, rural inflation is soaring. On a monthly basis, the rural index increased by 3.02 percent versus 2.15 percent increase in urban. The combined 2.5 percent increase doesn’t tell the whole story. The year or year rural food inflation stood at 17.8 percent versus 15.1 percent for urban.
The core inflation in July stood at 6.3 percent. Here again, rural inflation is much higher – at 7.8 percent as compared to 5.3 percent in urban centers. This implies that the story of high rural inflation is beyond the supply side impact of high food prices. To asses this, economic demand pickup in rural economy has to be evaluated. With currency adjustments, prices of food produce are converging to international levels. Prior to 2018, food commodity prices were at premium to international market. The prices were sticky and farmer had to rely on domestic demand. The situation reversed in 2019—domestic prices came at a discount to international prices. Now the domestic prices (for wheat and sugar, for instance) are moving up to converge to international prices.

Better pricing is boosting rural demand. The other factor is COVID. The impact of the coronavirus on the rural economy is much lower compared to the urban economy. Government policies – such as low urea prices have benefited the farm community. These all are adding to demand, which is why core inflation in rural is higher and may remain high. Policy makers will have to address this.


Comments
Comments are closed.