

HINO) is a popular name in the commercial vehicle segment of the automotive industry and a market leader in light and heavy commercial vehicles assembling buses, trucks, prime movers and special purpose vehicles. The latter is used for hauling a variety of supplies, such as food, equipment and machinery. Hino has the biggest assembling capacity in the segment with two plants of 6000 and 1800 units of chassis and body manufacturing, respectively. According to numbers reported by Pakistan Automotive Manufacturers Association (PAMA), the company's share in the trucking segment has remained between 40- 45 percent. In FY18 however, Isuzu for the first time recorded slightly higher truck sales than Hino. In the bus segment, Hino has started facing competition from Master Motors but remains comfortably ahead in the segment. The company has a strong Hino brand, a vast dealership network and after sales services support and it also exports to the Middle Eastern and African countries.
Hino was established in 1986 by UAE-based Al-Futtaim group and PACO Pakistan through a collaboration of two Japanese companies Hino Motors and Toyota Tsusho Corporation (TTC). In 1998, PACO Pakistan and Al-Futtaim disinvested in the company leaving the two Japanese companies (Hino Motors Japan and Toyota Tsusho Corporation) to take over control.
Together the Japanese partners own 89 percent of the shares of the company with Hino Motors being the holding company since 1998. It held over 59 percent of the shares as at Mar-18 while Toyota Tsusho held nearly 30 percent in the period. Only 10 percent of the company's shares were held by the general public and financial institutions.
Financial and operational performance (year ending March)
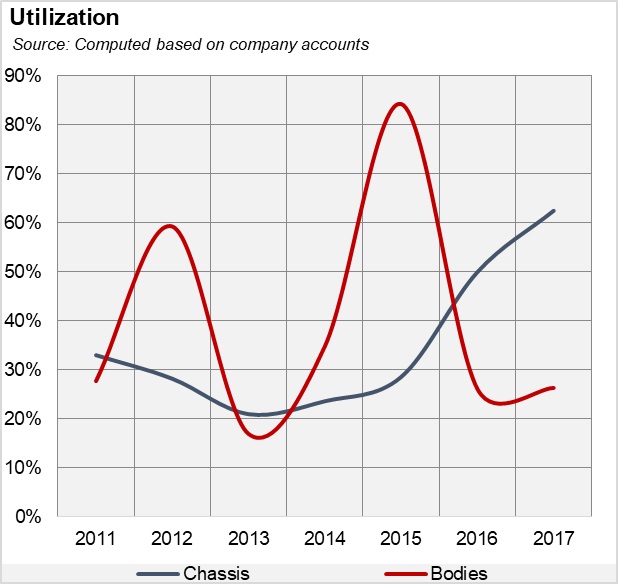
Despite being a market leader, Hino's two production facilities for chassis and body manufacturing are not functioning at their maximum capacity. Even though, the chassis assembly plant has been operating above 50 percent since 2016 (up to 70 percent in 2018), the body manufacturing plant with a nameplate capacity of only 1800 units has lately been barely producing 400-500 bus bodies. Capacity utilisation was 26 percent in 2016 which grew to 28 percent in 2018. But this is a function of demand since the company has maintained a strong market share in the segment despite lower volumes. In the past, during 2012 and 2014 and 2015, capacity utilisation was 59 percent, 35 percent and a decent 84 percent respectively.
Local bus demand has fluctuated significantly. Higher imports, less organic demand, higher usage of passenger cars and motorcycles for inter and intra-city travel, the launch of new mass transit projects in Islamabad and Lahore may be some reasons for demand slowdown.
The company claims that its only commercial vehicle assembling company to have an advanced body manufacturing facility as well as chassis, so underutilising its existing capacity is a shame. Hino could think about expanding its export or becoming part of the Hino global value chain. This would also open doors for Hino to expand further and cater to a much wider market.
Its other major product is chassis, which are the lower part of the vehicle, consisting of the frame on which the body of the trucks is built. This is where Hino gets over 90 percent of its revenues. This segment has grown significantly over the years as production grew closer to the capacity. In addition, the company has also been making Hilux frames for Indus Motors Company. Since 2016, Hilux frames have doubled and speak for the rising demand for Indus' pickups.
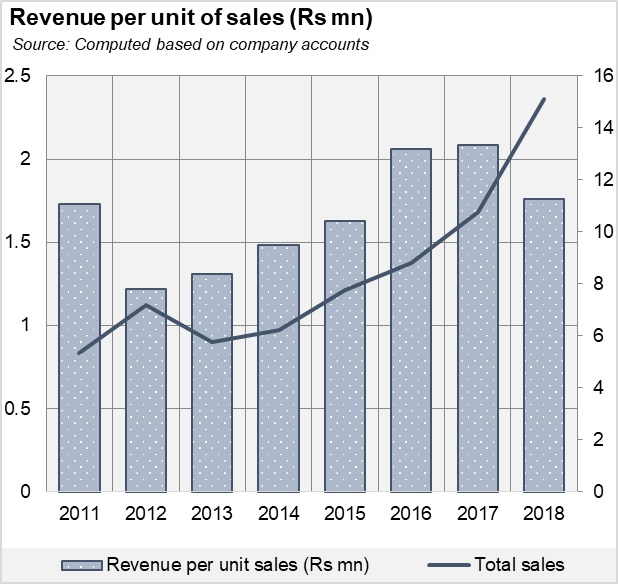
The company has been investing back to upgrade and modernise technology. Revenue stream has been diversified through the sales of Hilux frames, bodies, spare parts, and others while the company also exports chassis and bus bodies though export volumes are not available. Revenue has steadily gone up since 2012 as truck sales improved (see graph). The doubling of Hilux frames has also shored up revenue growth.
On the costs side, though the company procures parts locally, it does depend on imported raw materials and parts. When commodity prices such as steel go up, costs of production for local auto parts makers' rise which in turn raises prices for automakers. Similar is the case with currency depreciation. During 2018, the company incurred an exchange loss of Rs637 million against Rs51 million the previous year. However, despite higher costs, prices were not raised by the company as such. As computed, revenue for chassis per unit only grew by 4 percent in that year. Margins dropped from 15 percent in 2016 to 11 percent in 2018. These have continued to decline in the current marketing year for the company.
Opportunities and outlook in the commercial segment
Demand has become a real dampener for Hino since marketing year of 2019 kicked off in April-18. In the nine-months ending Dec-18, the company demonstrated a 16 percent drop in revenue brought forth by a 25 percent drop in truck sales. In a great turnaround, bus sales grew by 34 percent, though they could not cushion the blow to profits because of their volumetric insignificance. The beating that the truck segment has been taking led to a 48 percent drop in net profits. Margins fell from 12 percent to 6 percent in the nine-month period. Restriction on non-filers to purchase vehicles, market being flooded with old and used trucks, higher diesel prices, and lower demand coming from the logistics industry at large has all affected truck sales.
Still the revenue per unit went up by 5 percent which means what was sold fetched better prices but decline in demand ultimately came to bite back. The rupee depreciation (27 percent since Dec-17) led to much higher costs of import inputs which resulted in the fall in margins and the slight increase in prices did not help much. Another reason may be the demand for the market shifting toward Chinese vehicles, which are better priced and the rise of new truck importers entering the space.
Adverse foreign exchange rate and upward movement of commodity goods could bring costs of production up, while the rise of used and resold trucks in the market could continue to curb the demand for fresh vehicles. Going forward, regulatory oversight and the implementation of the transport policy may result in replenish of fleets by fleet managers and logistic companies which may result in higher truck sales. Market players argue that truck demand will balloon substantially once the CPEC routes are fully functional. This is something truck assemblers are banking on, and new investors have been eyeing as well. Hino is in the midst of it, though the competition will get a lot more intense.


=======================================================
Hinopak Nine Months Ending Dec-18
=======================================================
(mn Rs)                          Dec-18   Dec-17    YoY
=======================================================
Sales                            15,389   18,342   -16%
Cost of Sales                    14,454   16,204   -11%
Gross Profit                        935    2,138   -56%
Distribution                        281      302    -7%
Administrative                      313      306     2%
Other income                        132      244   -46%
Other operating expenses           0.97      108   -99%
Finance cost                     821.72   233.56   252%
Profit (loss) before tax          (349)    1,434
Taxation                            244      466   -48%
Profit (loss) after tax           (593)      967
Earnings (loss) per share (Rs)     (48)    78.01
GP margin                            6%      12%   -48%
NP margin                           -4%       5%
=======================================================
Source: Company accounts
===========================================================
Pattern of Shareholding (as on March 30, 2018)
===========================================================
Categories of Shareholders                                %
===========================================================
Associated Companies                                 89.00%
Hino Motors Ltd. (Hinopak Motors Limited
is Toyota Group Company and
subsidiary of Hino Motors Ltd., Japan. Toyota Motors
Corporation is the ultimate parent of the group)     59.33%
Toyota Tsusho Corporation, Japan                     29.67%
NIT and ICP                                           3.52%
Executives                                           0.003%
Banks, development finance institutions,             0.002%
non-banking finance companies, insurance
companies, takaful, modarabas and pension funds
Modrabas, Mutual funds and others                     0.72%
Others                                                   2%
Public                                                   5%
                                                       100%
===========================================================
Source: Company accounts


Comments
Comments are closed for this article.