

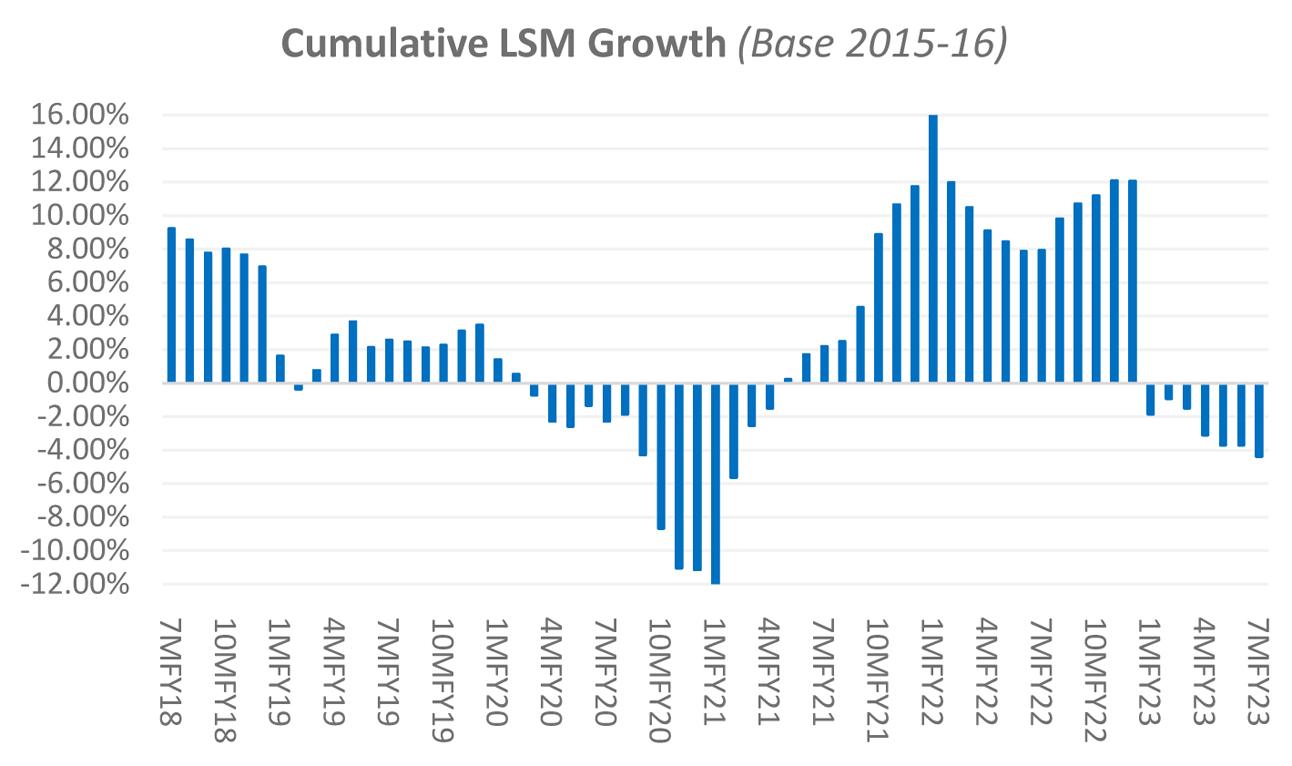
Large Scale Manufacturing growth slipped 7.9 percent year-on-year in January 2023. For 7MFY23 – LSM is down 4.4 percent. Both are lowest in well over a decade – excluding the peak Covid period from March 2020 to July 2020. This is the seventh straight month of LSM recording year-on-year loss in growth –which is a first.
The breadth of the slide makes it more worrisome – as only four of the 22 broad categories within the LSM basket showed year-on-year positive growth. This is a 180 degree change from the same period last year, where 16 sectors were showing positive year-on-year cumulative growth, some of them well into double digits.
Among the four sectors showing positive growth - they made it to the LSM basket only after the recent rebasing exercise. Wearing apparel based on export quantity of readymade garments, footballs, and furniture. Readymade garment export quantities have continued to grow over 40 percent year-on-year for most part of the year - despite a small decline in dollar terms, as average unit prices have come down drastically.
Furniture export quantity growth dipped year-on-year for January – still up on cumulative basis, making the second largest impact on overall LSM growth, with just 0.5 percent weight. Oddly, the PBS export data sheets are not adding up with readings shown in the LSM tables, for both readymade garments and furniture. There may not necessarily be a sinister element to it, as the LSM computation still relies on monthly aggregate, and does not err on a specific side so as to give an impression of artificially bolstering growth. Whatever it is, it would not hurt for the PBS to investigate – as it is the issuing authority for both datasets.
All else is painted red and the drop is only expected to go deeper given the precarious macroeconomic situation and industries from textile to chemicals and automobiles to cement announcing temporary shutdowns for a variety of reasons. January numbers do not show the impact that the mini budget taxation measures will likely have on production of tobacco and beverage sectors – with a considerable overall weight. Textile’s dip has entered double-digits, which is a rarity. Given the recent rise in policy rate, withdrawal of concessional energy tariffs, and import curbs –further slide in textile output cannot be ruled out.
Pakistan’s LSM seems well on its way to negative growth for FY23 – down from double digit growth in the last two years. The bottom appears far off from here.


Comments
Comments are closed.