

The manner in which the Federal Board of Revenue reveals tax directories reminds one of that old joke about balance sheets: they reveal everything but hide the most important elements. True to its words, the FBR’s has shared its tax directories where it has simply listed the names, NTN and tax paid of every filer without considering that in the absence of adequate categorization of information, it is simply a mountain of data from which gleaning policy relevant insights is quite an onerous task. But here are some key takeaways and queries that stem from FBR’s tax directory of Association of Persons.
Total tax collection from Association of Persons fell 6 percent in FY18, compared to 7 percent growth in collection from companies in the same year. Considering that Association of Persons are usually either project-based firms that have a short life span of a project, or otherwise generally smaller businesses compared to SECP-registered companies, could it be so that the economy hit smaller business hard in FY18 which led to 6 percent fall in tax collection from Association of Persons. This cannot be answered in the absence of detailed classification of the data in tax directories.
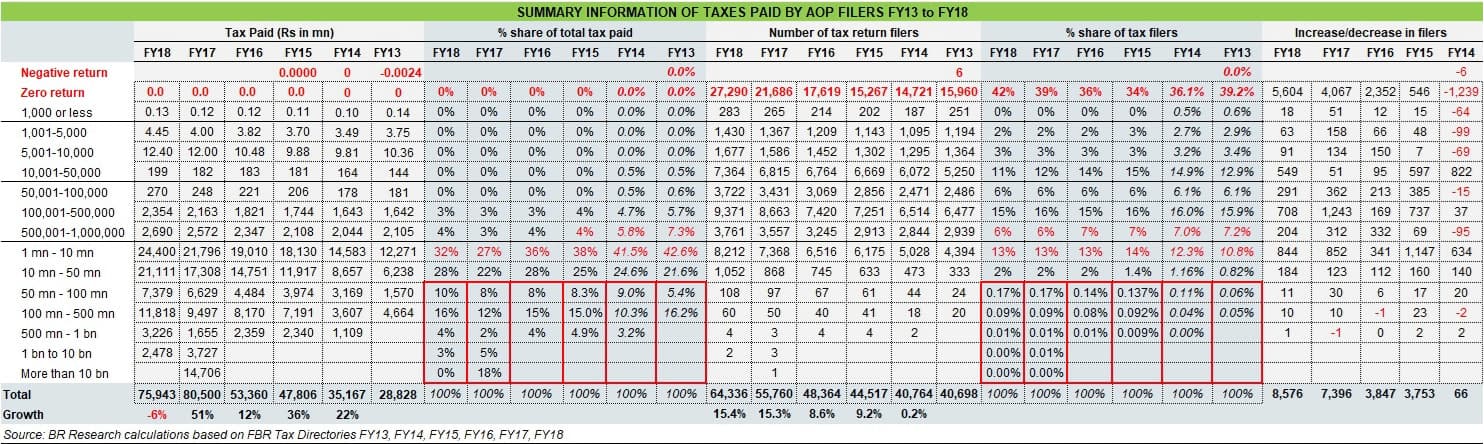
The second insight from AOP directory is that growth in total AOP filers saw little change in FY18 compared to the year before, whereas growth in filers who filed a return of zero rupees picked up pace, growing at 26 percent in FY18 from 23 percent in FY17 and 15 percent in the year before. Zero return AOP filers were 42 percent of total AOP filers in FY18, up from 34 percent in FY15. If the returns reflect honest representation of their taxable income, then these numbers raise serious concerns over the thesis of economic growth between FY13-FY18. And if these returns do not truly reflect taxable incomes, then it is another example of poor tax administration by the FBR.
The third takeaway that jumps from the table either reflects inequality of income or an unequal playing field where some businesses are under FBR’s radar while others hide in the shadows. Less than half percent (0.27 percent) of AOP filers accounted for 33 percent of tax collection from AOP in FY18. In FY13, 0.11 percent of AOP filers accounted for 22 percent of tax paid by such businesses. Or consider that just 15 percent of AOP filers accounted for a whopping 92 percent of tax paid by AOP in FY18.
In the absence of other relevant details such as total number of AOPs in the country, their sector-wise classification, their district wise location and so forth, the analysis of tax directory on AOP is an exercise of limited utility. But these insights alone should trigger a fresh debate on the state of tax affairs in the country.


Comments
Comments are closed.