

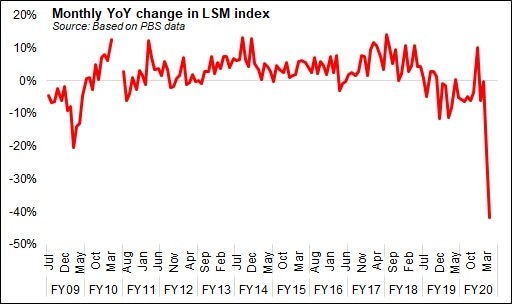
Last week, Pakistan’s Large-Scale Manufacturing (LSM) index reported a year-on-year drop of nearly 42 percent in April 2020. That’s almost double the fall reported in March 2020 and raises question marks over the provisional LSM contraction of 7.78 percent estimated in the Economic Survey FY20.
There are hardly any leading indicators that can shed light on the production data that feed into the LSM, save for a few items such as auto, cement, refineries, which provide some clue over the extent of fall in LSM in May 2020.
If data by Pakistan Automobile Manufacturers Association is any guide, average fall in production in May 2020, across cars, motorbikes, tractors, LCVs and trucks, was about 60 percent. In the case of cement, production tracked by the LSM is expected to have fallen 40 percent year-on-year in May 2020, where the estimate is based on the data reported by All Pakistan Cement Manufacturers Association.
Refineries haven’t posted latest data, but production of POL products is not expected to be at May 2019’s levels of 1.3 billion liters. Meanwhile, production outlook for cotton cloth and yarn also doesn’t look promising as both local cotton production and cotton imports have fallen off the mark. (See BR Research’s ‘Cotton importers at a loss?’ Jun 18, 2020).
However, in the absence of reliable leading indicators for several other sub-sectors (including the heavy weight cotton) that feed into the manufacturing index, LSM’s historical trends provide some clue.
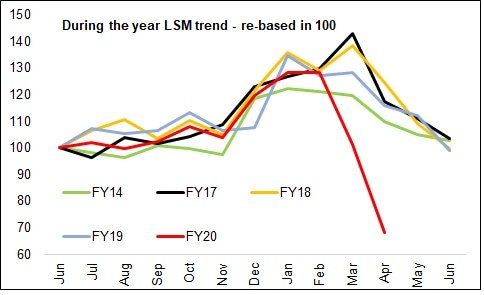
On monthly basis, the LSM index usually peaks in March every year, and then continues to taper off sequentially in April, May and June given the usual seasonal swings in production. But let’s optimistically assume that the reading for May and June 2020 will be 15 percent higher (at 100 points in both May/Jun) than the reading for April 2020 (85.1 points), as the lockdown had come to an end by then and production activities resumed as is evidenced in some cases such as automobile sector.
However, even by that optimistic reading, the full year LSM contraction will likely be around 11.45 percent compared to the government’s provisional estimate of 7.78 percent, eventually leading to a downward revision in GDP growth estimates for FY20. (See also ‘LSM’s post-mortem report’ May 18, 2020).


Comments
Comments are closed.