


US natgas futures rise 3% as output falls and Waha prices stay negative
- Price increase comes despite forecasts for less demand next week
US natural gas futures climb 3% to a one-week high, driven by recent output declines, despite forecasts for lower demand and ample storage levels.
- Negative natural gas prices at the Waha Hub.
- Reasons for recent US natural gas production declines.
- Impact of mild weather on natural gas storage.
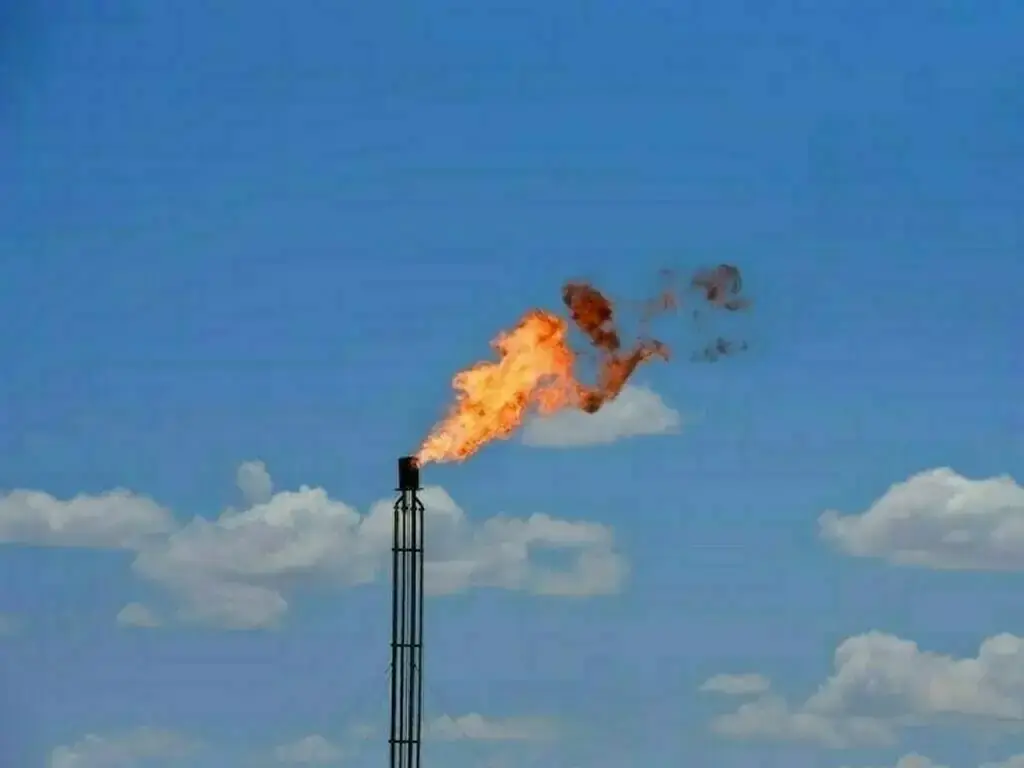

NEW YORK: U.S. natural gas futures climbed about 3% to a one-week high on a decline in output in recent weeks.
That price increase came despite forecasts for less demand next week than previously expected and ample amounts of gas in storage.
Front-month gas futures for June delivery on the New York Mercantile Exchange rose 8.4 cents, or 3.0%, to $2.841 per million British thermal units (mmBtu), putting the contract on track for its highest close since May 4.
In the cash market, average prices at the Waha Hub in West Texas have remained in negative territory for a record 66 days in a row as pipeline constraints trap gas in the Permian region, the nation’s biggest oil-producing shale basin.
Daily Waha prices first averaged below zero in 2019. They did so 17 times in 2019, six times in 2020, once in 2023, 49 times in 2024, 39 times in 2025, and a record 75 times so far this year.
Waha prices have averaged a negative $2.29 per mmBtu so far in 2026, compared with a positive $1.15 in 2025 and a positive $2.88 over the past five years (2021 to 2025).
Supply and demand
LSEG said average gas output in the U.S. Lower 48 states held at 109.6 billion cubic feet per day (bcfd) so far in May, the same as in April. That compares with a monthly record high of 110.6 bcfd in December 2025.
Output has declined in recent weeks as low spot prices caused some energy firms, like EQT, the second-largest U.S. gas producer, to reduce production as they wait for prices to rise in the future.
Analysts said mild weather earlier this spring allowed energy firms to inject more gas into storage than usual.
But, they noted, recent output declines coupled with higher demand from near-normal weather likely reduced the inventory surplus to around 6% above normal during the week ended May 7, down from 7% above during the week ended May 1.
Meteorologists forecast the weather will remain mostly near normal through May 26.
LSEG projected average gas demand in the Lower 48 states, including exports, would hold around 98.7 bcfd this week and next. The forecast for next week was lower than LSEG’s outlook on Friday.
Average gas flows to the nine big U.S. LNG export plants fell to 17.2 bcfd so far in May, down from a monthly record high of 18.8 bcfd in April.


























Comments