

The power generation in February 2019 went down by 6 percent year-on-year to 6.4 billion units – lowest in 24 months. The power demand has slowed down considerably, evident from three consecutive months of year-on-year drop in power generation. There have only been four such instances in the last 36 months. All this while, the power generation capacity has soared to nearly 31000 MW – up 6000 MW from a year ago.

Hydel generation is back to the fold, constituting the biggest share of 23 percent in the generation mix – up from just 6 percent last month. Hydel’s gain is furnace oil’s loss.
These two sources have shown the strongest correlation in the recent months. The load falls on FO the moment there is a dip in hydel based generation – and vice versa.
The absolute drop in FO based generation in February 2019 is 1.6 billion units, and the hydel generation went up by 1.1 billion units. Last month FO had the largest share with 22 percent – as the month-on-month drop of 0.85 billion units in hydel was covered by 0.8 billion units rise in FO based power generation.

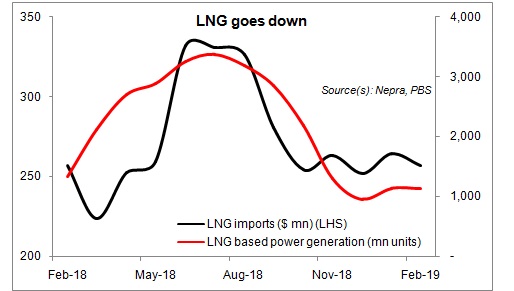
A rather worrying trend is that of RLNG based generation – the share of which has consistently been on a decline. For February, since there was almost negligible FO based power generation; RLNG was always going to be underutilized, being low on the merit list when compared to the likes of hydel, gas, and coal. But, within RLNG, some of the more efficient plants such as Nandipur and Orient stayed idle – and a few with costs higher than even FO pumped in power. The merit order has been a joke for quite some time, and for February, the excuse of FO based generation was not there either, to justify the underutilization and a mockery of merit order.
The demand will start rising soon, as summers approach. The capacity to generate power is very much there. But do not expect the FO based generation to completely go away even if all coal and RLNG plants are made fully available. The refineries are still running and producing FO and it will have to be procured by the government. At times the fuel cost for FO may well be lower than RLNG – but when it is not, efficiency will be compromised.
And the cost of inefficiency will be borne by the paying consumer – in the form of inflated fuel cost component of the tariff. The actual fuel cost component in the past twelve months has been higher by Rs99 billion than the reference tariff in the last 12 months. That translates into Rs0.8 per unit (pre-tax) in terms of fuel cost adjustment alone. On the other hand, the ratio of capacity payments to total tariff is also growing considerably – making matters worse.


Comments
Comments are closed for this article.