


Rupali Polyester Limited: performance and outlook
Rupali Polyester Limited (RUPL) faced significant financial decline from 2023-2025, marked by falling sales, losses, and margin erosion, primarily due to economic instability, high costs, and intense competition from dumped imports.
- Rupali Polyester's declining sales and increasing losses from 2023.
- Challenges from dumped imports, high costs, and economic instability.
- Strategic workforce reductions and new long-term loan.
- Future outlook and plans for modernization and efficiency.

Rupali Polyester Limited (PSX: RUPL) was incorporated in Pakistan as a public limited company in 1980. The principal activity of the company is the manufacturing and sale of polyester products.
Pattern of Shareholding
As of June 30, 2025, RUPL has a total of 34.068 million shares outstanding which are held by 717 shareholders. Trusts have the majority stake of 81.04 percent in the company followed by individuals holding 12.60 percent shares. Directors, CEO, their spouse and minor children account for 3.085 percent of RUPL’s outstanding shares. Around 2.163 percent of the company’s shares are held by its executives and 1.088 percent by Banks, DFIs, NBFIs, Insurance companies, Modarabas & Mutual Funds.
The remaining ownership is distributed among other categories of shareholders.
Financial Performance (2021-25)
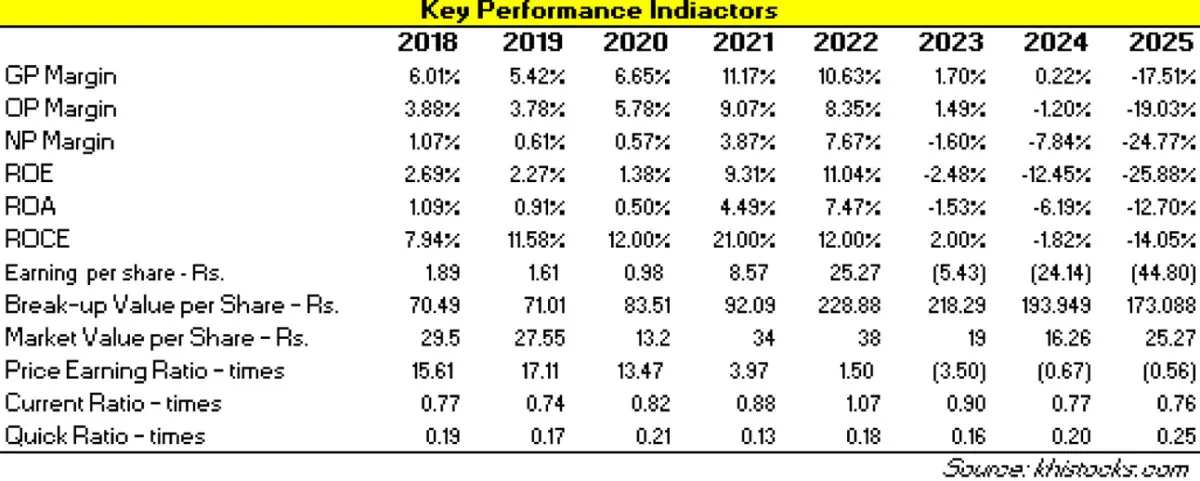
Over the period under consideration, RUPL’s topline slid twice i.e. in 2024 and 2025. Conversely, its bottomline posted a decline in all the years except 2021 and 2022. In 2023, RUPL posted net loss which further enlarged in 2024 and 2025.
The company’s margins improved in 2021. In 2022, net margin rose while gross and operating margins plunged. In the subsequent years, the margins followed a downward trajectory and registered their lowest level in 2025. The detailed performance review of the period under consideration is given below.
In 2021, RUPL’s net sales recorded year-on-year growth of 27.73 percent to clock in at Rs.7554.43 million. Production volume rose by 42 percent during the year which bear testament to improved sales volume and resumption of economic activity after the slowdown experienced on account of COVID-19.
Cost of sales also hiked by 21.55 percent in 2021 owing to higher cost of raw materials as well as elevated energy charges. However, with improved demand in the local market, the company was able to pass on the onus of cost hike to its consumers. This resulted in 114.48 percent higher gross profit recorded by the company in 2021 with GP margin reaching its optimum level of 11.17 percent from 6.65 percent in 2020.
Distribution expense expanded by 29.33 percent in 2021 as higher sales volume drove up the freight charges. Administrative expense eroded by 2.58 percent in 2021.
Higher profit related provisioning resulted in 268.98 percent surge in other expense in 2021. Conversely, lower fair value gain on investment property drove other income down by 44.51 percent in 2021. RUPL recorded 100.46 percent stronger operating profit in 2021 with OP margin of 9.07 percent versus OP margin of 5.78 percent registered in 2020.
Finance cost shrank by 40.30 percent in 2021 on account of lower discount rate combined with reduced borrowings. As a consequence, net profit magnified by 771.58 percent in 2021 to clock in at Rs.292.065 million with EPS of Rs.8.57 and NP margin of 3.87 percent. This was against the EPS of Rs.0.98 and NP margin of 0.57 percent recorded in 2020.
In 2022, RUPL’s topline magnified by 48.64 percent to clock in at Rs.11,229.28 million. Due to dumping of low quality imported PFY in the market the company’s sales volume was adversely affected in the 4QFY22. This is also evident in 6 percent lower production volume achieved by the company in 2022. Moreover, global commodity super cycle induced by Russia-Ukraine war coupled with Pak Rupee depreciation, hike in energy prices and indigenous inflationary pressure drove the cost of sales up by 49.56 percent in 2022.
Gross profit grew by 41.40 percent in 2022, however, GP margin ticked down to 10.63 percent. Distribution and administrative expense spiked by 13.54 percent and 21.65 percent respectively in 2022 which was the result of higher freight charges and payroll expense. Other expense mounted by 90.81 percent in 2022 due to increased donations and profit related provisioning.
During 2022, RUPL didn’t book any gain on fair value of investment property, resulting in 9.11 percent lower other income. Operating profit augmented by 36.90 percent in 2022, however, OP margin slipped to 8.35 percent. Despite monetary tightening taking place during the year, RUPL was able to cut down its finance cost by 48.08 percent in 2022 by considerably settling its outstanding borrowings. This translated into 194.83 percent rise in net profit which clocked in at Rs.861.092 million in 2022 with EPS of Rs.25.27 and NP margin of 7.67 percent.
RUPL’s topline registered a marginal 2.65 percent year-on-year growth to clock in at Rs.11,526.87 million in 2023. While anti-dumping duty was imposed on imported PSY, lackluster demand by the textile industry due to overall economic slowdown resulted in 13 percent lower production volume attained by RUPL in 2023.
Smuggling of imported products further restrained the demand in the local market. Cost of sales registered a surge of 12.91 percent in 2023 on account of global commodity super cycle, Pak Rupee depreciation, energy supply crisis, escalated power tariff etc. Gross profit thinned down by 83.62 percent in 2023 with GP margin sliding to 1.70 percent. Distribution and administrative expense soared by 14.81 percent and 15.77 percent respectively in 2023 on account of higher prices of POL products which drove up the freight charges and also because of higher payroll expense incurred during the year.
Operating expense, to a great extent, was counterbalanced by 235.85 percent higher other income which was mainly the result of fair value gain on investment property. Other expense dipped by 86.24 percent in 2023 due to no provisioning done for WWF and WPPF.
Operating profit shrank by 81.67 percent in 2023 with OP margin moving down to 1.49 percent. RUPL endured massive 372.12 percent spike in its finance cost in 2023 on account of unprecedented level of discount rate and higher short-term borrowings. Increased borrowings resulted in the company’s gearing ratio mounting to 25 percent in 2023 from 11 percent in 2022.
Higher finance cost coupled with the imposition of super tax pushed RUPL in net loss of Rs.184.828 million in 2023 with loss per share of Rs.5.43.
In 2024, RUPL’s net sales declined by 9 percent year-on-year to clock in at Rs.10,485.06 million. This was due to insufficient sales volume which was the product of economic instability and influx of imported goods at low prices. Production volume dropped by 18 percent in 2024.
The company increased the prices of its products to offset the cost pressure particularly elevated prices of PTA and MEG and skyrocketed energy tariffs. Gross profit shrank by 88.05 percent in 2024 with GP margin drastically falling down to 0.22 percent. Lower sales volume resulted in 0.96 percent slump in distribution expense in 2024.
Conversely, administrative expense inched up by 2.52 percent in 2024 owing to inflationary pressure. This was despite the fact that the company streamlined its workforce from 1262 employees in 2023 to 1176 employees in 2024. The company recorded 45.74 percent drop in its other income in 2024 due to high-base effect as the company recorded hefty fair value gain on investment property in the previous year.
Scrap sales also dipped in 2024. Other expense mounted by 51.13 percent in 2024 due to generous donations disbursed during the year. RUPL incurred operating loss of Rs.126.02 million in 2024. To add to ado, finance cost surged by 85.67 percent in 2024 on the back of high discount rate and increased short-term borrowings to meet working capital requirements.
Gearing ratio mounted to 39 percent in 2024. The company posted highest ever net loss of Rs.822.505 million in 2024, up 345 percent year-on-year. This translated into loss per share of Rs.24.14 in 2024.
In 2025, RUPL recorded a massive 41.23 percent year-on-year slide in its topline which clocked in at Rs.6162.28 million. This was due to weaker demand in the domestic market owing to a decline in the economic activity and rigorous competition from dumped imported products.
While anti dumping duties were imposed, they proved to be ineffective on account of stays provided by the High Court. A petite dumping margin of 5 percent was levied on major Chinese importers resulting in the continuation of price distortion in the local market.
Lower demand, inability to revise the prices coupled with soaring energy tariff and elevated raw materials (PTA and MEG) cost resulted in gross loss of Rs.1079.19 million in 2025. This was the first time that the company posted gross loss. Lower sales volume culminated into 22.50 percent drop in distribution expense in 2025.
Administrative expense also nosedived by 4 percent in 2025 as the company was in the process of restructuring in workforce. Number of employees was reduced from 1176 in 2024 to 767 in 2025. Other expense escalated by 73.38 percent in 2025 on the back of higher donations.
Other income improved by 41.98 percent in 2025 on account of grater scrap sales and gain recognized on the sale of property, plant & equipment. RUPL’s operating loss multiplied by 830.67 percent to clock in at Rs.1172.85 million in 2025.
Finance cost tapered off by 29.15 percent in 2025 due to monetary easing and a slide in short-term borrowings. It is to be noted that RUPL acquired an unsecured and non-interest bearing long-term loan of Rs.1220.417 million in the last quarter of 2025.
The company had no long-term loans on its books until March 2025. This gives a hint of some expansionary plan or BMR of the existing plant by the company in the pipeline. Net loss escalated by 85.58 percent to clock in at Rs.1526.328 million in 2025. This translated into loss per share of Rs.44.80 in 2025.
Recent Performance (9MFY26)
During the nine-month period of the ongoing fiscal year, RUPL’s net sales deteriorated by 55.17 percent to clock in at Rs.2360.588 million. This was the consequence of weaker demand of domestic PFY and cut-throat competition from dumped products.
During the period under review, the company also underwent digitalization of its sales invoices as per the directive of FBR which took more time than expected and impacted the company’s sales as the data was linked with the downstream customers.
Global economic volatility which inflated the cost of key inputs particularly gas and electricity coupled with elevated fixed cost per unit due to thinner capacity utilization resulted in gross loss of Rs.287.51 million in 9MFY26, down 51.55 percent year-on-year. Higher petroleum prices and inflationary pressure pushed up distribution expense by 25.58 percent and administrative expense by 34.60 percent in 9MFY26.
Other expense dipped by 96.90 percent in 9MFY26 apparently due to lesser donations and charity.
During the period under consideration, RUPL recognized other income of Rs.614.796 million, up 497.53 percent year-on-year. This conveniently absorbed the company’s operating expense and other expense and culminated into operating profit of Rs.77.84 million in 9MFY26. This was against the operating loss of Rs.709.33 million incurred in 9MFY25. Fatter other income appears to be the outcome of gain recognized on the disposal of fixed assets as well as interest income. Monetary easing resulted in 25.16 percent decline in finance cost in 9MFY26.
Despite dropping, finance cost was huge enough to hinder RUPL’s operating profit from trickling down. This coupled with higher effective tax rate due to the imposition of super tax resulted in net loss of Rs.214.576 million in 9MFY26, down 79 percent year-on-year. This translated into loss per share of Rs.6.30 in 9MFY26 versus loss per share of Rs.30.02 recorded in 9MFY25.
Future Outlook
Stability in the local economic backdrop will result in improvement in the demand of PSF and PFY. The company is all set to grab this opportunity by installing modern machinery which will not only boost its production capacity but will also provide operational efficiency.
However, for the local manufacturers to fully benefit from the forecasted economic recovery, the government needs to take strict measures to curb the dumped imports.


























Comments