


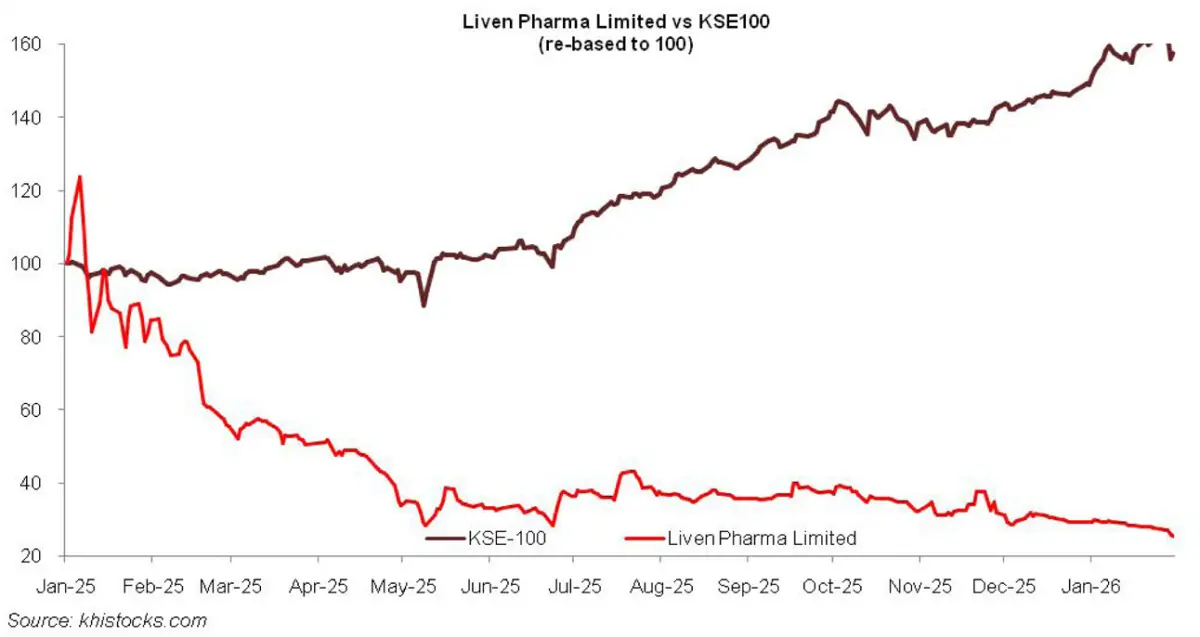
Liven Pharma Limited (PSX: LIVEN) was incorporated in Pakistan as a private limited company in 1991 and was converted into a public limited company in 1992.
The company came into existence in 2024 when Landmark Spinning Industries Limited (PSX: LMSM) merged with Liven Pharmaceutical (Private) Limited.
After merger, the company changed its business from trading, manufacturing and selling of yarn to manufacturing and selling of pharmaceutical and related products.
Pattern of Shareholding
As of June 30, 2025, LIVEN has a total of 93.040 million shares outstanding which are held by 2034 shareholders.
Directors, Sponsors, Senior Management officers and their associates have the majority stake of 86.97 percent in the company. Out of the remaining 13.03 percent shares, around 4.65 percent shares are in physical form while the remaining 8.38 percent shares are available as free float distributed among different categories of shareholders.
Historical Performance (2025)
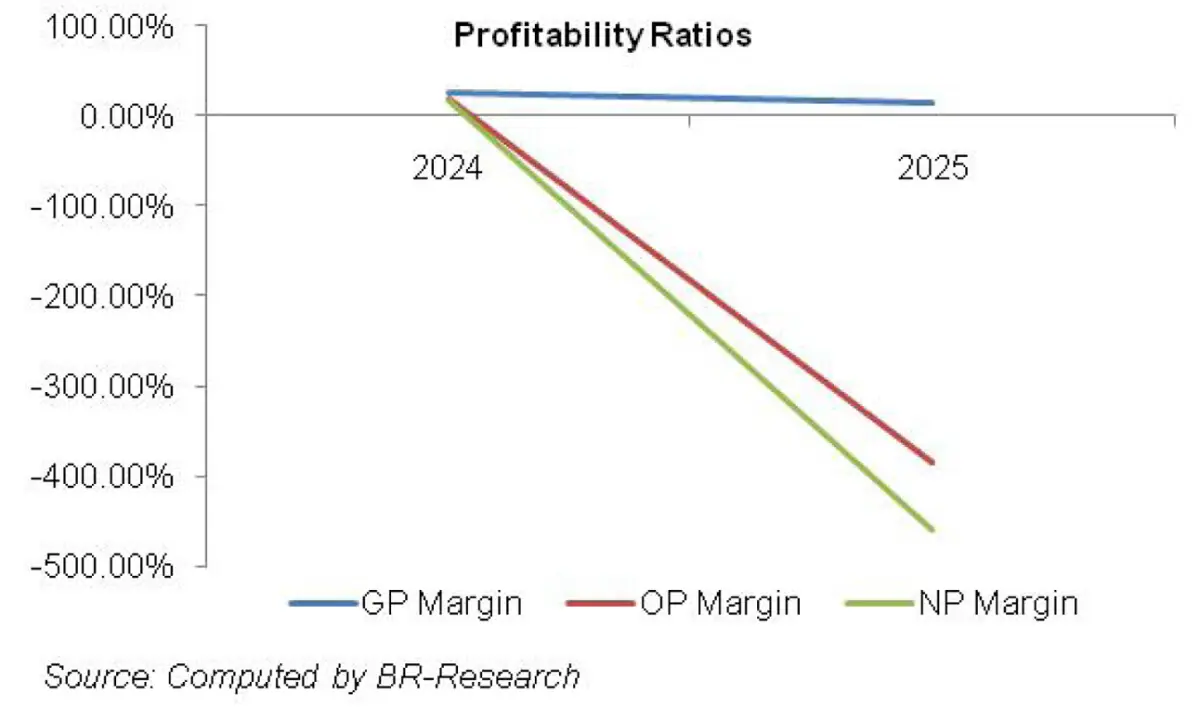
In 2025, LIVEN’s net sales deteriorated by 48 percent to clock in at Rs.127.27 million. Gross profit also dipped by 71.22 percent in 2025 with GP margin falling down from 25.46 percent in 2024 to 14.11 percent in 2025. This was due to the transitional impact of integration and operational scaling after merger arrangement.
Administrative expense surged by 2396.21 percent in 2025. This mainly comprised of listing charges worth Rs.327.803 million. Fee & subscription charges as well as Directors’ remuneration also spiked during the year.
The company also expanded its workforce from 32 employees in 2024 to 41 employees in 2025, leading to greater payroll expense.
Selling & distribution expense sky-rocketed by 297.15 percent in 2025 due to higher salaries of sales force, advertisement expense, boarding, lodging and travelling charges, fuel & power expense as well trainings & seminars charges incurred during the year.
Unlike the previous year, LIVEN recorded other expense of Rs.116.90 million in 2025. This comprised of allowance for ECL and bad debts written off during the year. The company also registered other income to the tune of Rs.0.306 million in 2025 on account of profit on bank deposits recognized during the year.
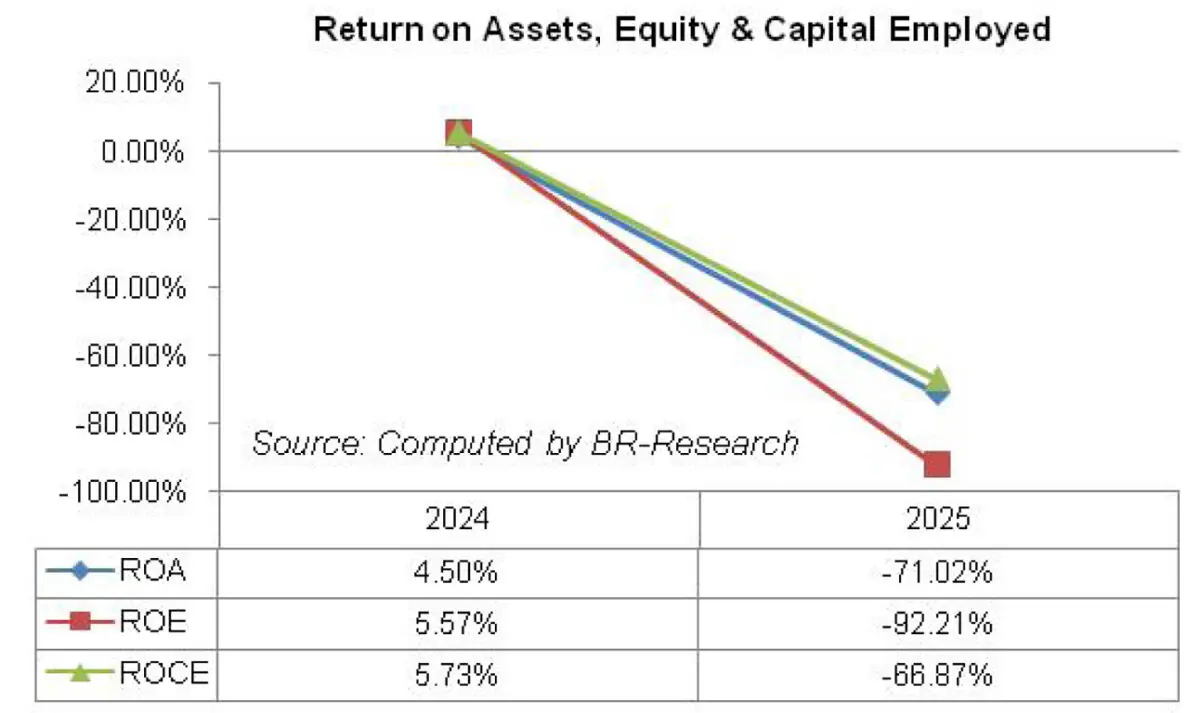
LIVEN posted operating loss of Rs.489.81 million in 2025 versus operating profit of Rs.42.99 million recorded in 2024.
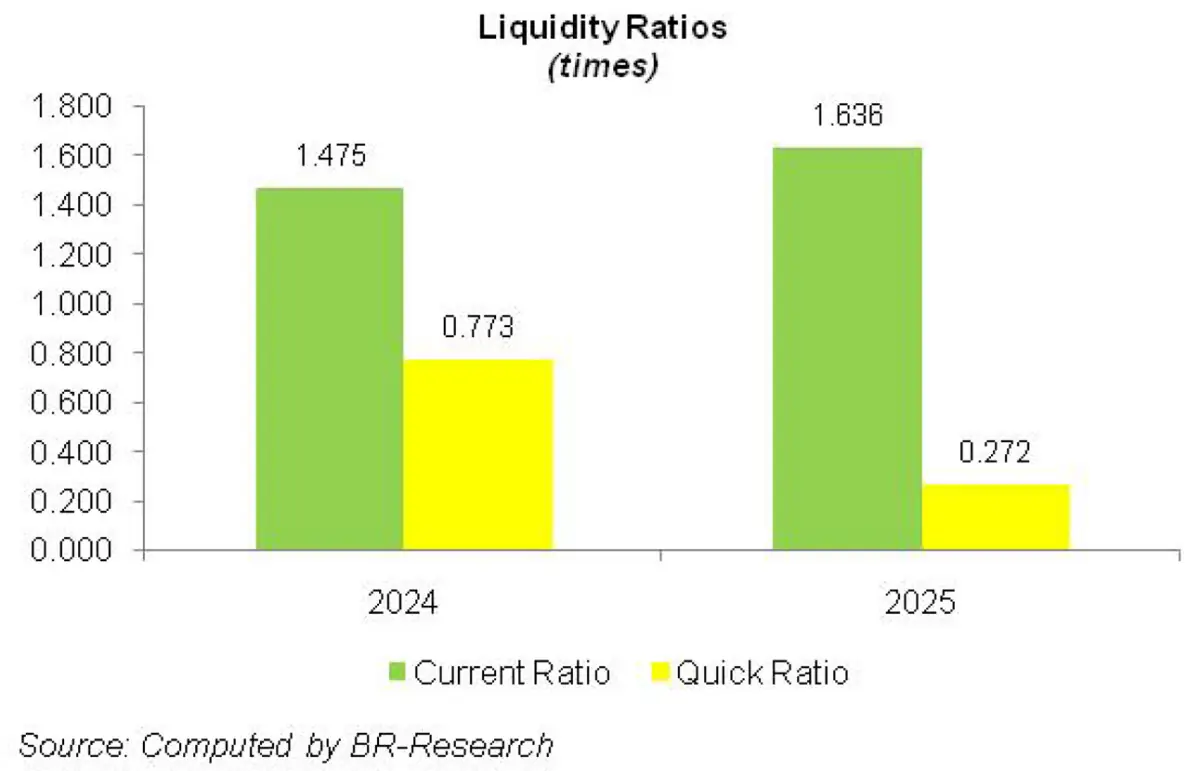
Finance cost escalated by 3155.20 percent in 2025 to clock in at Rs.0.786 million. Gearing ratio clocked in at 4.11 percent in 2025 versus 14.97 percent in the previous year.
Overall liabilities decreased during the year on the back of settlement of interest-free loan obtained from the directors through issuance of shares. Conversely, external liabilities increased during the year which led to higher interest expense.
Tax expense also massively increased during the year due to the effect of deferred taxation. This expense was non-cash in nature and arose from timing differences between accounting and tax treatments, however, impacted the company’s bottomline.
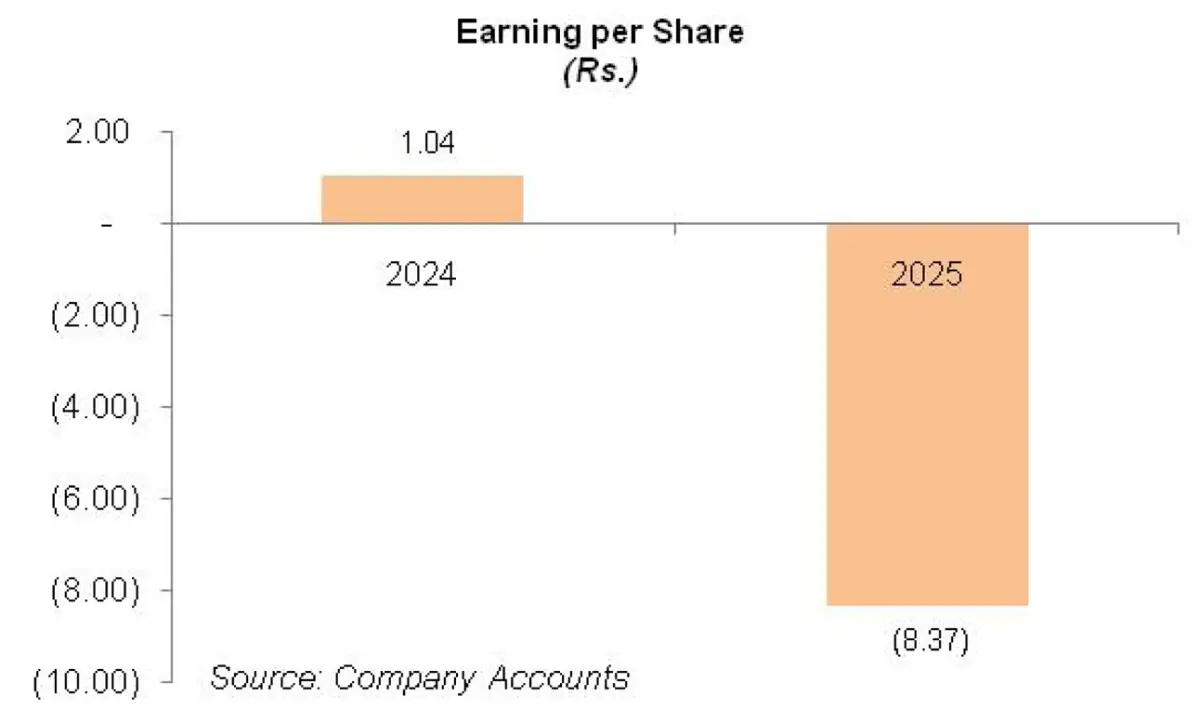
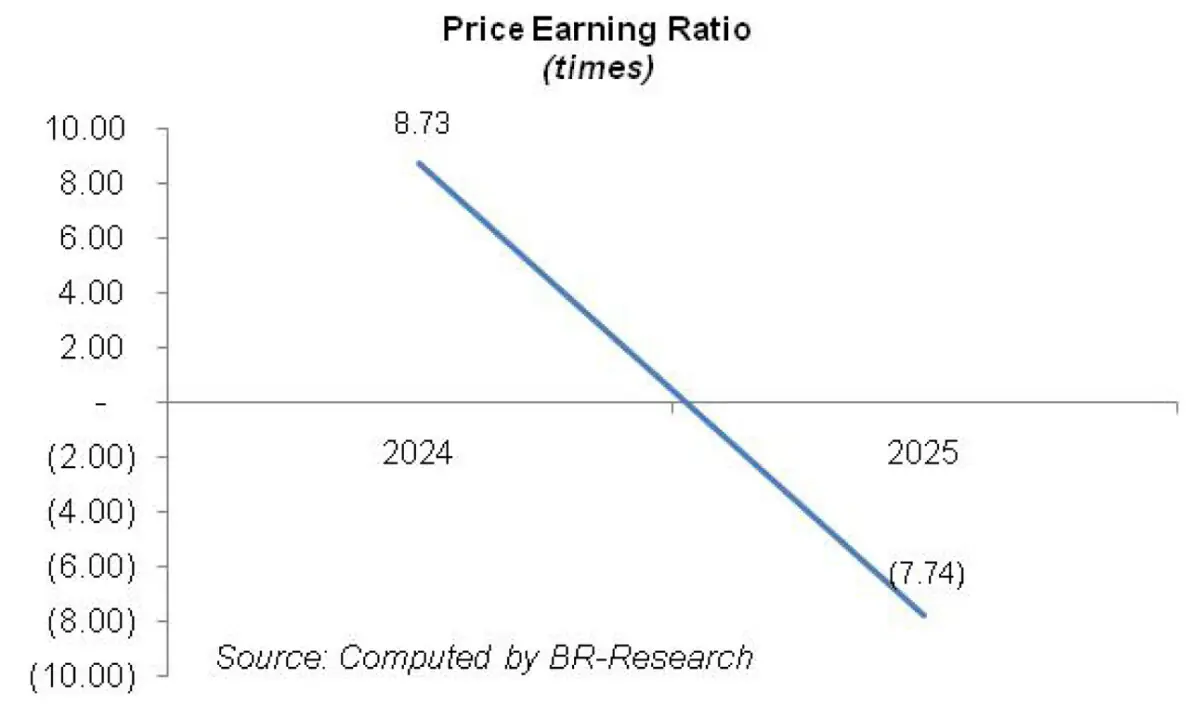
LIVEN recorded net loss of Rs.584.460 million in 2025 which translated into loss per share of Rs.8.37. This was against net profit of Rs.41.744 million and EPS of Rs.1.044 posted in 2024.
Recent Performance (1QFY26)
During the first quarter of the ongoing fiscal year, LIVEN posted 90 percent plunge in its topline which clocked in at Rs.8.82 million. As a new business arrangement post-merger, the company’s main goal was to attain operational efficiency and cost management before attaining robust sales volume.
While gross profit plummeted by 84.15 percent in 1QFY26, GP margin clocked in at 44.57 percent versus GP margin of 27.91 percent recorded in 1QFY25. As the company continued to adapt its operations, its administrative expense surged by 104.18 percent in 1QFY26.
Unlike 1QFY25, where the company incurred no selling expense, it recorded selling expense to the tune of Rs.4.77 million in 1QFY26. This was likely due to greater advertisement expense and salaries of sales of force to attain deeper market penetration.
Monetary easing resulted in a massive decline in other income (which comprise of profit of bank deposits) in 1QFY26.
LIVEN posted operating loss of Rs.31.11 million in 1QFY26 versus operating profit of Rs.134.48 million recorded in 1QFY25.
Unlike 1QFY25, where there was no finance cost as the company’s liabilities comprised of interest-free loan from directors, finance cost was recorded at Rs.0.635 million in 1QFY26 due to external borrowings. LIVEN posted net loss of Rs.30.157 million in 1QFY26 with loss per share of Rs.0.32. This was against net profit of Rs.147.588 million and EPS of Rs.12.17 registered in 1QFY25.
Future Outlook
As the company becomes accustomed to the new business line, industry parameters and working environment, it accelerated its efforts to attain greater sales volume. This is evident by the fact that the company completed its first export order to the Arab region in the 2QFY26. Recently, the company has commissioned Rs.8 million blistering packing line from China which will reportedly increase its production capacity by 12 to 15 percent. The company also plans to issue right shares to finance its expansion which includes the establishment of Dry Powder Injectables division.
Copyright Business Recorder, 2026


Comments