


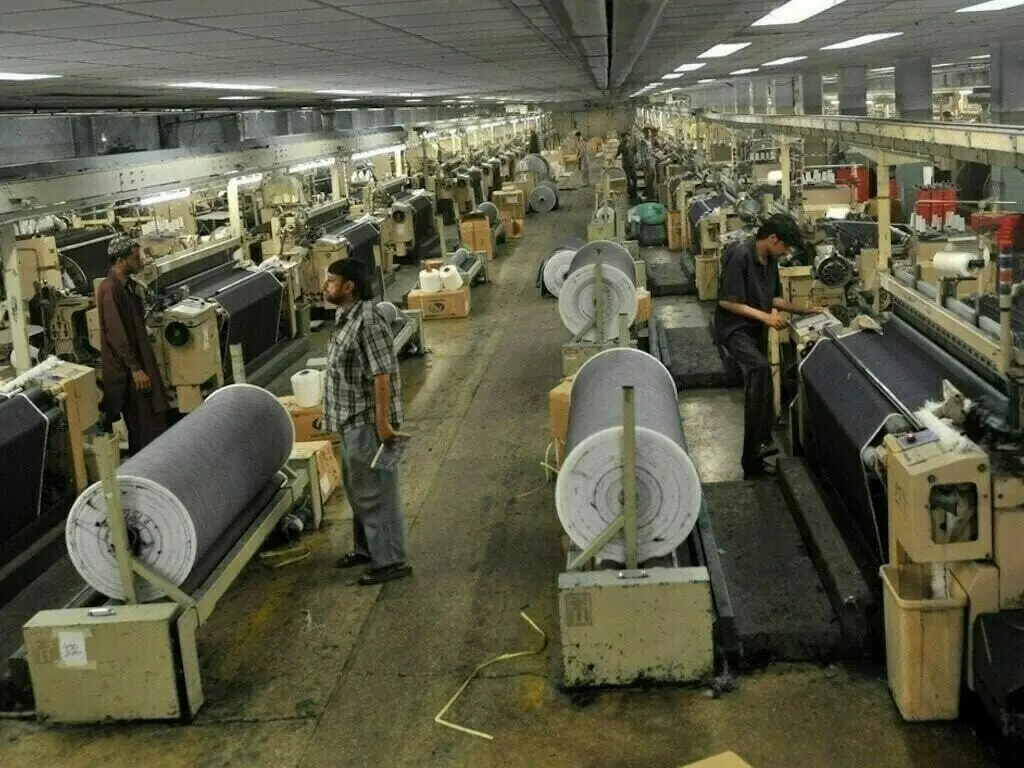

ISLAMABAD: Large-Scale Manufacturing (LSM) sector growth declined by 2.75 percent on a month-on-month basis in August, but in the first two months of FY26, it still ended up in the positive zone on a year-on-year basis.
According to the figures released by the Pakistan Bureau of Statistics, the overall LSM has shown a growth of 4.44 percent during the period pf July-August 2025-26, compared to the same period of last year.
The LSM output increased by 0.54 percent in August 2025, as compared with August 2024, and decreased by 2.75 percent compared with July, FY25. In July, LSM registered an impressive growth of 9 percent on a YoY basis.
July FY26: Large-Scale Manufacturing sector grows 9% YoY in Pakistan
The main contributors in the overall growth of 4.44 percent as per their weightage in Quantum Index Numbers of Large Scale Manufacturing Industries (QIM) are food (1.02), tobacco (0.17), textile (-0.03) garments (0.84), paper & board (0.21), petroleum products (-0.21), chemicals (-0.13), pharmaceuticals (-0.11), cement (0.98), iron & steel products (-0.16), electrical equipment (0.08), machinery and equipment (-0.11), automobiles (1.83), other transport equipment (0.23), and furniture (-0.17).
The sectors showed positive growth in July-August FY26 compared to the corresponding period of last year, are food 7.77 percent, tobacco 11.06 percent, wearing apparel 4.92 percent, paper & board 8.41 percent, rubber products 24.9 percent, non-metallic mineral products 17.31 percent, automobiles 90.4 percent, other transport equipment 44.47 percent and other manufacturing (football) 19.35 percent.
The sectors showing decline during July-August FY26 compared to the corresponding period of last year are beverages -2.68 percent, textile -0.15 percent, wood products -1.65 percent, coke & petroleum products - 2.69 percent, chemicals (chemical products, fertilisers) -1.47, pharmaceuticals -1.77 percent, iron & steel products 3.44 percent, fabricated metal -0.19 percent, machinery and equipment -33.84 percent and furniture -10.84 percent.
Copyright Business Recorder, 2025




















Comments
Comments are closed for this article.