



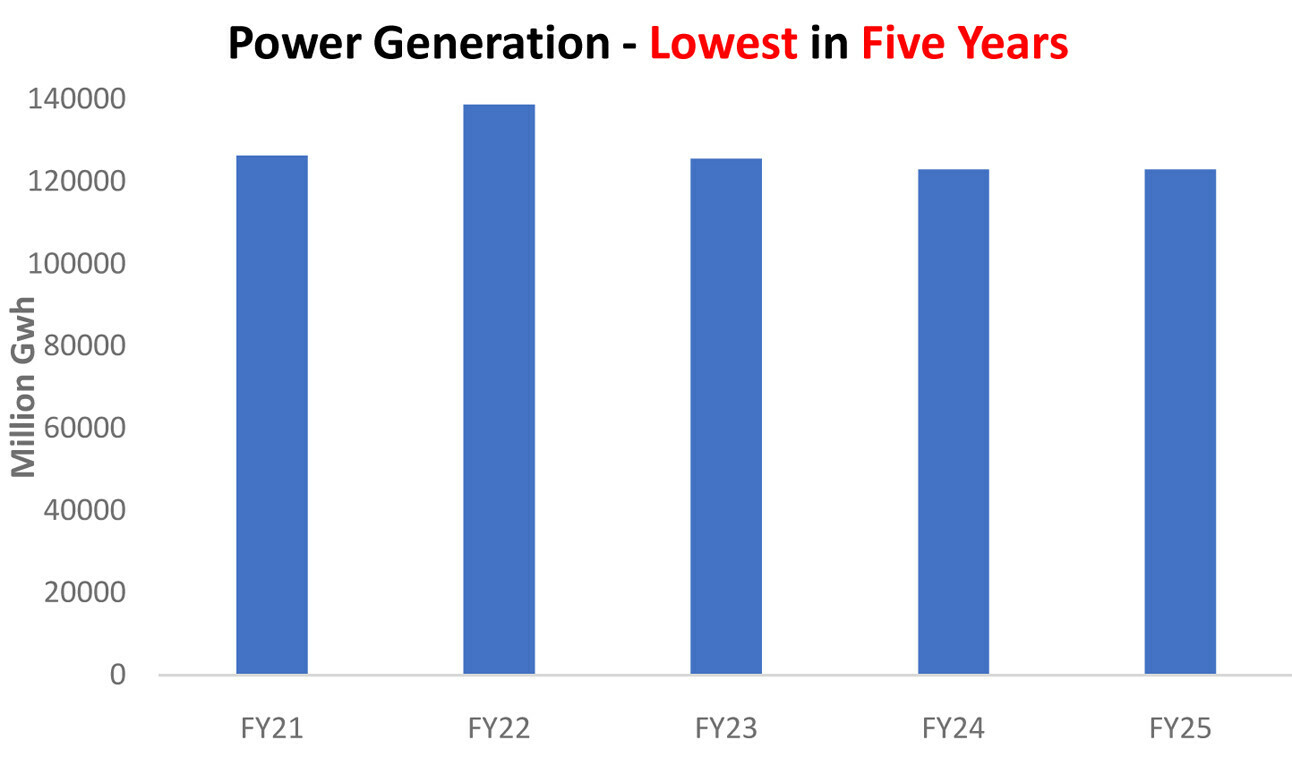
Power generation for FY25 has closed at 122.96 billion units, effectively flat year-on-year with a negligible 0.06 percent dip. But scratch the surface, and the stagnation tells a deeper story. This marks the lowest annual generation in five years, still 11 percent shy of the FY22 peak of 139 billion units.
Even the modest 1.8 percent year-on-year growth in June 2025 hardly impresses—it remains below FY21 levels and barely edges past the pandemic-struck June 2020.
All this has happened despite a sharp rise in installed capacity. Back in FY20, the capacity component of the Power Purchase Price (PPP) for nearly the same number of units cost Rs794 billion—Rs7 per unit.
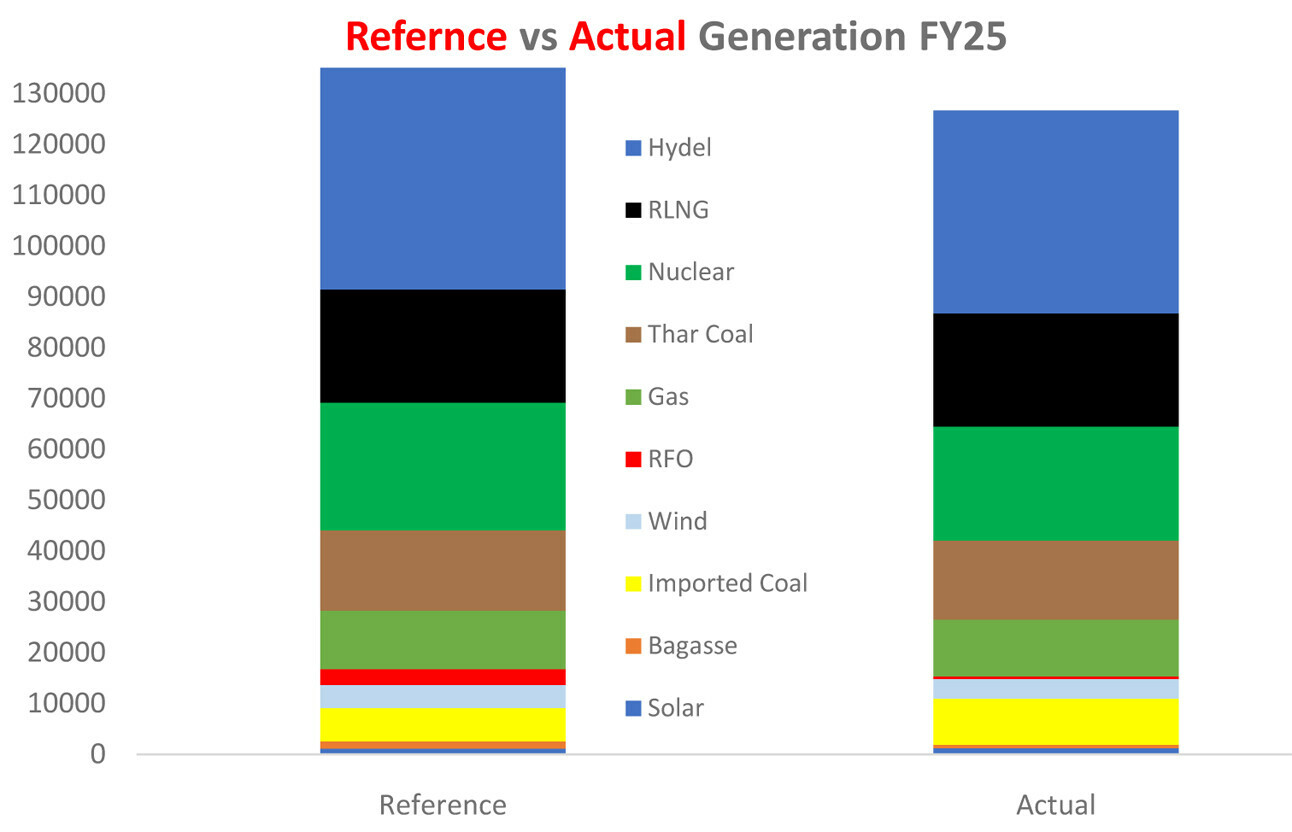
Fast forward to FY25, and the capacity bill for the same output has ballooned to Rs17.5 per unit, with the official reference assuming Rs15.9 for a hefty Rs2.1 trillion bill for capacity charges. A 6 percent shortfall from reference generation means additional fiscal burden—an outcome the system can scarcely afford.
Fortunately, the fuel component of the PPP offered some relief, with international commodity prices and the PKR largely stable through FY25. But that alone won’t bail out the system.
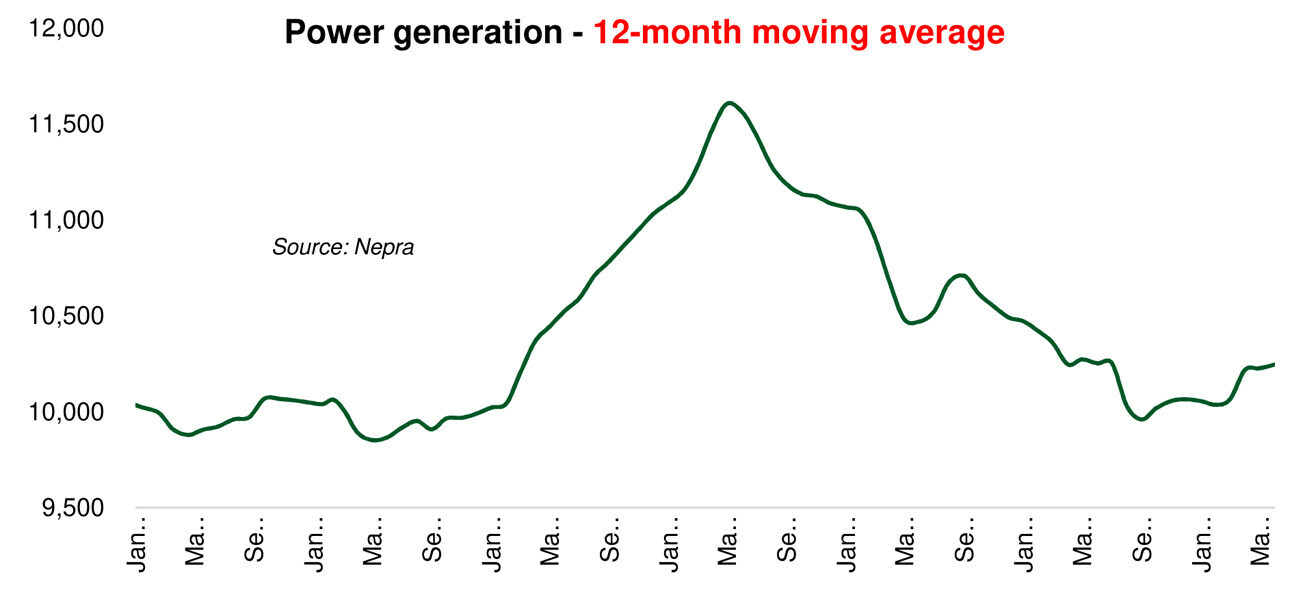
What’s more troubling is that the dip in grid generation doesn’t reflect a proportional fall in national demand. Rooftop solar continues to pull demand off the grid, a trend flagged repeatedly in thisspace. At the same time, industrial users’ reliance on captive power has kept grid demand suppressed. The recent shift in policy to push industries back to the grid will reclaim some of that lost demand—but not all.
The household and commercial segment, especially those milking the overly generous net metering regime, will continue to shrink grid reliance. Reports suggest the Prime Minister has again blocked reforms to rationalize solar payback—the third such intervention in under a year. While solar remains viable (and should), the current net metering policy desperately needs fairness and balance to avoid systemic distortions.
Finally, don’t expect GDP to come to the rescue. Pakistan’s near-term growth outlook remains muted—meaning organic demand revival will be slow. Tariff reliefs and subsidy-led pushes may offer short-term support, but the real test lies in restoring grid demand at affordable rates. Without that, the system’s structural imbalances will persist.
Copyright Business Recorder, 2025




















Comments
Comments are closed for this article.