


Nadeem Textile Mills Limited (PSX: NATM) was incorporated in Pakistan as a public limited company in 1984. The company is engaged in the manufacturing and sale of yarn.
Pattern of Shareholding
As of June 30, 2024, NATM has a total of 21.267 million shares outstanding which are held by 41 shareholders. Directors, CEO, their spouse and minor children have the majority stake of 81.95 percent in the company while 7.21 percent shares are held by local general public. The remaining shares are held by other categories of shareholders.
Financial Performance (2019-24)
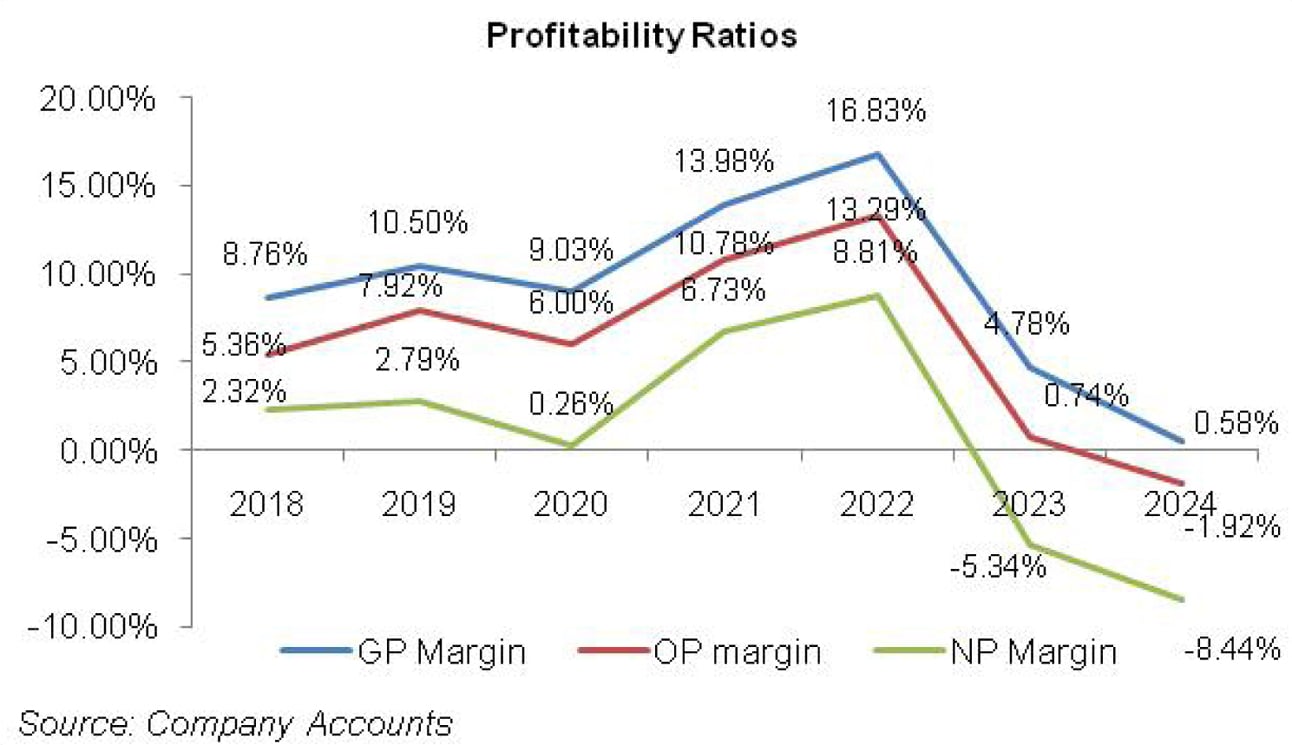
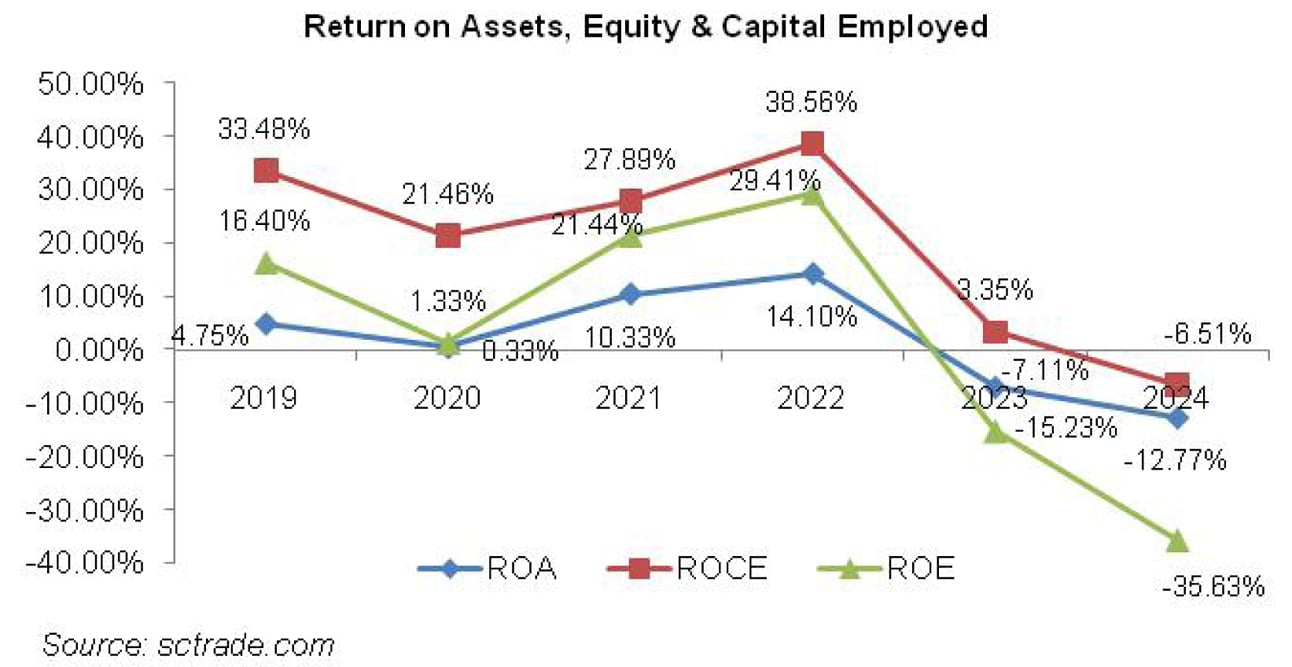
During the period under consideration, NATM’s topline and bottomline slid twice i.e. in 2020 and 2023. The company registered net loss in 2023 and 2024. NATM’s margins which reasonably grew in 2019 fell in 2020. This was followed by a rebound for the next two years and a slump in 2023 and 2024. NATM’s margins hit their lowest ebb in 2024. The detailed performance review of the period under consideration is given below.
In 2019, NATM’s net sales grew by 11.56 percent year-on-year to clock in at Rs.7186.10 million. During the year, the company produced 22.663 million kilograms of yarn which translated into capacity utilization of 96.49 percent versus capacity utilization of 95.60 percent registered in the previous year.
Depreciating local currency made export sales dearer and translated into 33.82 percent taller gross profit with GP margin clocking in at 10.5 percent in 2019 versus GP margin of 8.76 percent posted in the previous year. Administrative expense inched up by 8.35 percent in 2019 on the back of increased payroll expense despite the fact that the employees headcount reduced from 1313 employees in 2018 to 1208 employees in 2019.
Distribution expense shrank by 15.73 percent in 2019 due to lower ocean freight charges, octroi, export development surcharge and other export related expenses incurred during the year. Other expense also declined by 36.17 percent in 2019 due to high base effect as the company incurred exchange loss and loss on sale of fixed assets in 2019.
Other income mounted by 379.11 percent in 2019 on account of improved profit on saving deposits and gain on sale of fixed assets. This translated into 64.82 percent enhancement in operating profit in 2019 with OP margin clocking in at 7.92 percent versus 5.36 percent in 2018. Finance cost multiplied by 39.25 percent in 2019 due to elevated discount rate while outstanding borrowings reduced during the year.
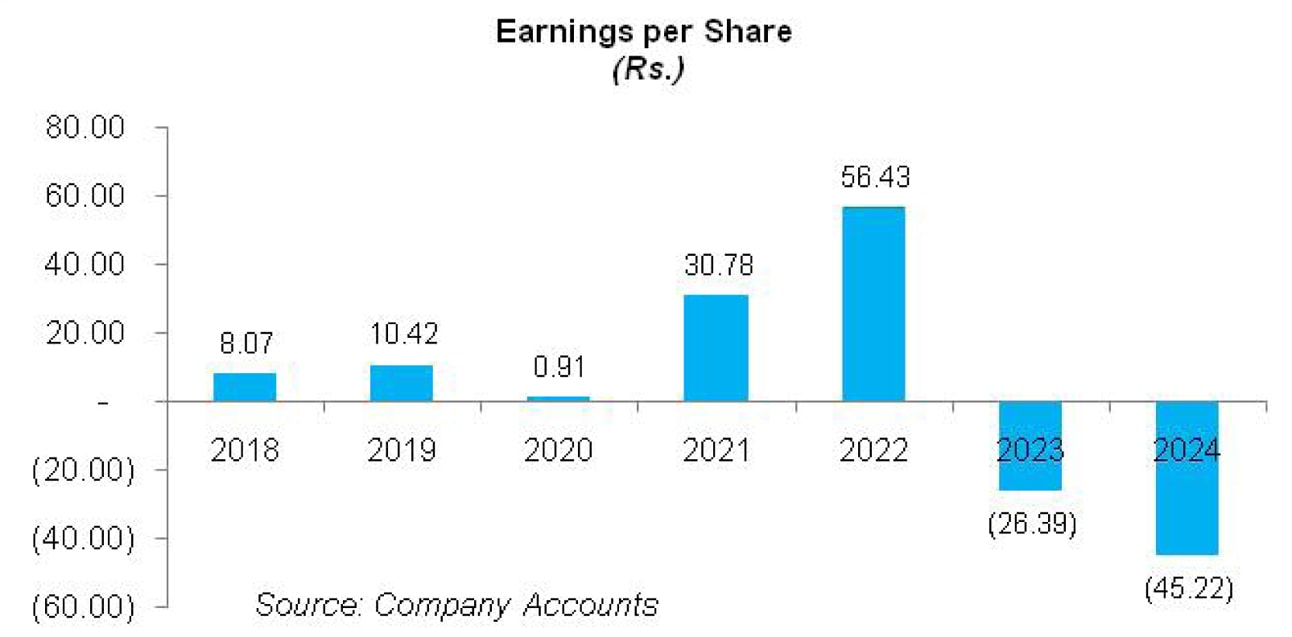
Net profit grew by 33.66 percent to clock in at Rs.200.16 million in 2019 with EPS of Rs.10.42 versus EPS of Rs.8.07 registered in 2018. NP margin stood at 2.79 percent in 2019 versus NP margin 2.32 percent posted in 2018.
In 2020, NATM’s topline plunged by 5.47 percent to clock in at Rs.6792.77 million. This was due to a decline recorded in local and global textile demand on account of COVID-19. Due to lockdown imposed across the globe, the company’s production activities got interrupted. This resulted in the production of 20.618 million kilograms of yarn. This translated into capacity utilization of 91.07 percent in 2020. Due to plant shutdown, fixed cost couldn’t be efficiently absorbed, resulting in 18.75 percent lower gross profit with GP margin moving down to 9.03 percent in 2020.
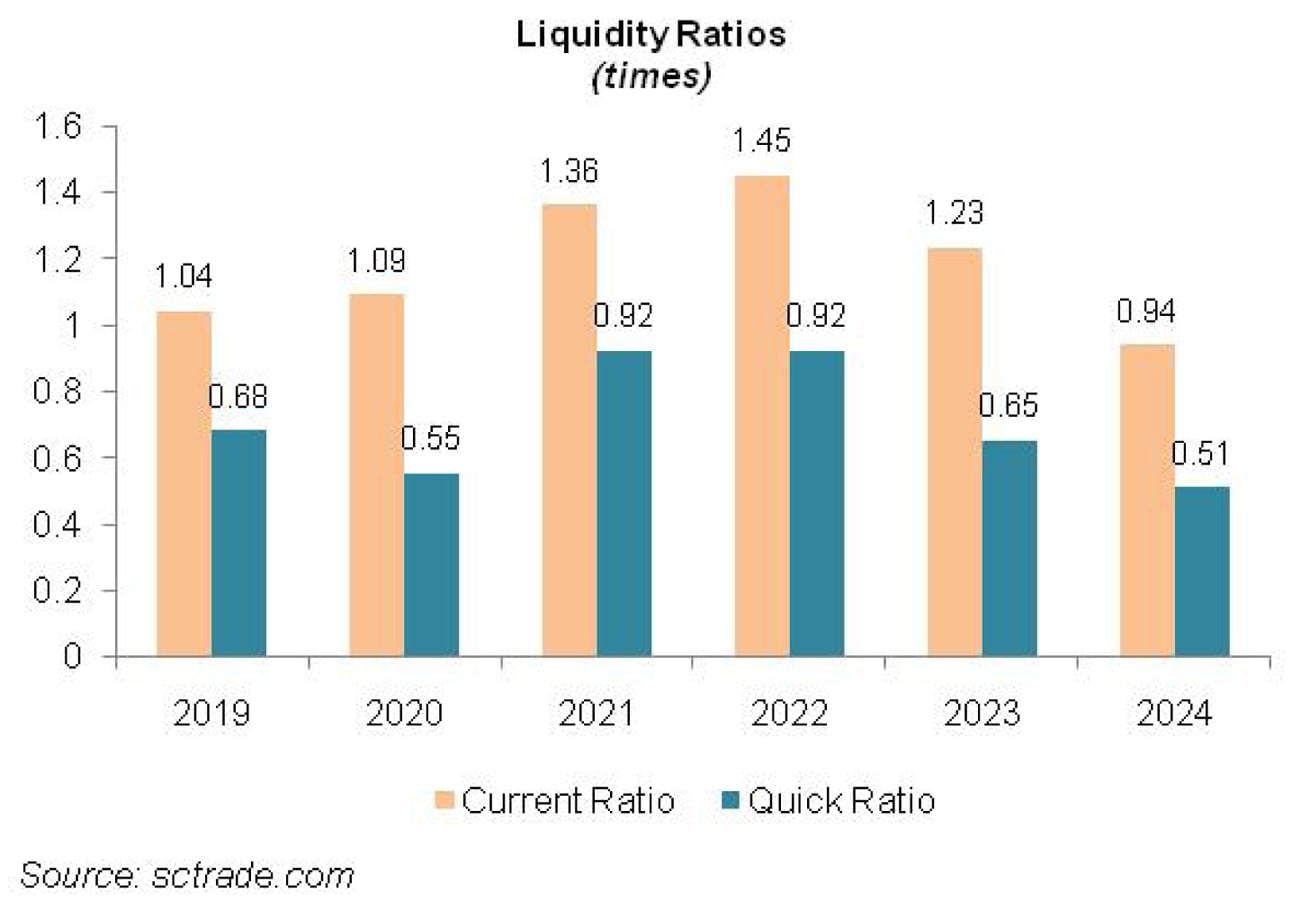
Administrative expense ticked up by 2.28 percent in 2020 on account of increased payroll expense as number of employees increased to 1220 in 2020. Conversely, distribution expense leveled down by 10.72 percent in 2020 due to lesser foreign travelling and lower export related expenses. Other expense mounted by 96.75 percent in 2020 due to exchange loss on account of lower export sales made during the year.
Other income slipped by 5.21 percent in 2020 as unlike previous year, NATM didn’t record any exchange gain and gain on sale of fixed assets in 2020. Operating profit dwindled by 28.42 percent in 2020 with OP margin dropping to 6 percent. Finance cost surged by 22.43 percent in 2020 due to higher discount rate for most part of the year coupled with increased short-term and long-term borrowings obtained during the year.
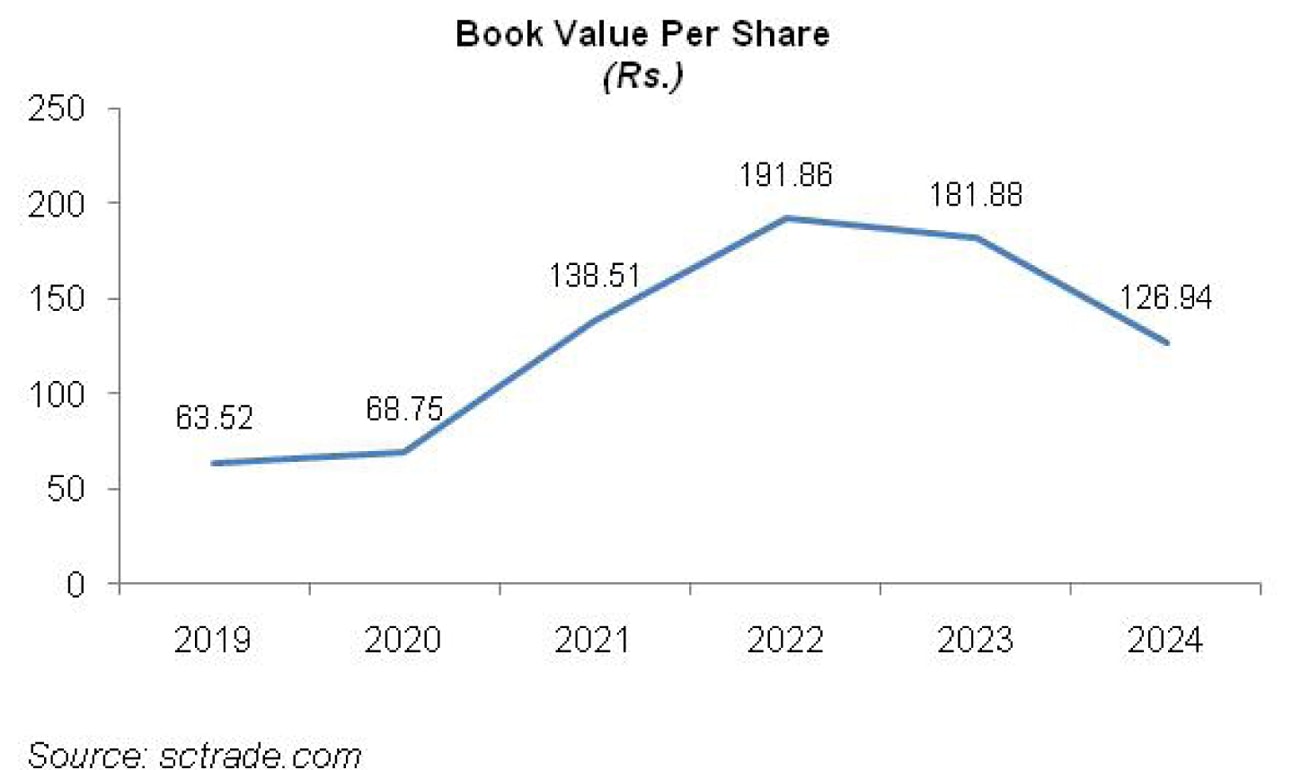
NATM’s net profit marched down by 91.23 percent in 2020 to clock in at Rs.17.54 million with EPS of Rs.0.91 and NP margin of 0.26 percent.
In 2021, NATM’s saw significant improvement of 39.77 percent in its topline which was recorded at Rs. 9494.36 million. However, this mainly came on the back of upward revision in selling prices during the year. During the year, NATM’s installed capacity increased to 26.491 million kilograms from 22.639 million kilograms in the previous year.
The company attained capacity utilization of 96.52 percent in 2021. Purchase of raw materials at cheaper rates resulted in 116.49 percent higher gross profit recorded by the company in 2021 with GP margin climbing up to 13.98 percent. Administrative expense multiplied by 15.14 percent in 2021 mainly on account of elevated payroll expense despite the fact that number of employees reduced to 1190 in 2021.
Distribution expense mounted by a massive 118 percent in 2021 due to higher freight & octroi as well as ocean freight charges incurred during the year. 32.11 percent higher other expense incurred by NATM in 2021 was the effect of increased profit related provisioning as well as provision booked for slowing moving stores and spares and ECL.
Higher profit on saving accounts, gain on sale of fixed assets, exchange gain as well as bad debts recovered during the year pushed up other income by 72.75 percent in 2021. As a consequence, operating profit multiplied by 151.11 percent in 2021 with OP margin mounting to 10.78 percent. Monetary easing as well as lower outstanding short-term borrowings resulted in 12.14 percent curtailed finance cost in 2021.
Net profit posted a phenomenal 3541.32 percent rise to clock in at Rs.638.87 million with EPS of Rs.30.78 and NP margin of 6.73 percent.
The growth trajectory continued in 2022 with topline posting 45.10 percent enhancement to clock in at Rs.13,775.87 million. Just like the previous year, the growth in net sales was largely driven by higher prices. Installed capacity further increased to 28.304 million kilograms while capacity utilization stood at 96.71 percent. Upward price revision and increasing proportion of export sales in the total sales mix of NATM culminated into 74.67 percent higher gross profit with GP margin attaining its highest level of 16.83 percent.
Administrative expense swelled by 19 percent in 2022 due to increased salaries, depreciation and motor vehicle expense incurred during the year. Workforce was squeezed to 1165 employees in 2022. Distribution expense escalated by 59.97 percent in 2022 due to hefty commission paid on local sales followed by export commission and ocean freight.
During the year, NATM booked higher provision for WWF, WPPF and ECL which combined with exchange loss resulted in 97.40 percent higher other expense. Other income nosedived by 37.15 percent in 2022 as there was no exchange gain and gain on sale of fixed assets recorded in 2022. NATM registered 78.89 percent higher operating profit in 2022 with OP margin recording its highest level of 13.29 percent.
Monetary tightening as well as elevated long-term and short-term borrowings resulted in 68 percent higher finance cost in 2022. Net profit expanded by 90 percent in 2022 to clock in at Rs.1213.98 million with EPS of Rs.56.43 and NP margin of 8.81 percent.
After two years of sustained topline and bottomline growth, NATM posted 22.57 percent lower net sales to the tune of Rs.10,666.65 million in 2023. This was on account of shrunken demand due to high inflation in the home market as well as global recession. Production reduced by 28.94 percent to clock in at 19.450 million kilograms. This translated into capacity utilization of 68.72 percent – the lowest among the period under consideration.
Lower absorption of fixed cost resulted in 78 percent thinner gross profit in 2023 with GP margin lowering down to 4.78 percent. Unprecedented level of inflation kept driving up the administrative expense which swelled up by 22.31 percent in 2023 despite workforce rationalization which resulted in 1145 number of employees in 2023. Lower sales volume resulted in 20.62 percent thinner distribution expense in 2023.
Other expense also narrowed down by 11.24 percent in 2023 despite hefty exchange loss and provision for ECL as the company didn’t book any profit related provisioning during 2023. Other income posted 161.50 percent enhancement in 2023 due to improved profit on saving accounts and TDRs as well as gain recorded on the sale of fixed assets.
Operating profit contracted by 95.66 percent in 2023 with OP margin standing at 0.74 percent. Finance cost hiked by 48.71 percent in 2023 due to higher discount rate and elevated borrowings. This resulted in net loss of Rs.569.29 million in 2023 with loss per share of Rs.26.39.
In 2024, NATM posted 6.79 percent year-on-year growth in its topline which clocked in at Rs.11,391.09 million. The company recorded capacity utilization of 70.50 percent which culminated into production of 19.834 million kilograms of yarn in 2024.
High cost of sales particularly elevated energy tariff and other input and conversion charges pushed down gross profit by 87.13 percent in 2024 with GP margin moving down to its lowest level of 0.58 percent. Administrative expense inched up by 6.20 percent in 2024 due to higher payroll expense. This was despite the fact that the company streamlined its workforce from 1145 employees in 2024 to 1095 employees in 2025.
Selling expense slid by 2.96 percent in 2024 due to lower ocean freight charges, lesser sales commission and a downtick recorded in export development surcharge. 85.28 percent lower other expense incurred by NATM in 2024 was due to no exchange loss realized as well as considerably lesser provisioning booked for ECL.
Other income mounted by 119.49 percent in 2024 due to exchange gain realized as well as reversal of provision booked for ECL. Profit recorded on TDRs also contributed in pushing other income up in 2024. NATM recorded operating loss of Rs.218.32 million in 2024.
Finance cost ticked up by 1.96 percent in 2024 due to higher discount rate. This was despite the fact that the company had lower outstanding borrowings in 2024 vis-à-vis last year. NATM’s net loss magnified by 68.94 percent to clock in at Rs.961.78 million in 2024. This translated into loss per share of Rs.45.22 in 2024.
Recent Performance (9MFY25)
In 9MFY25, NATM recorded 53.94 percent thinner topline to the tune of Rs.4361.20 million. This was not only because of reduced demand but also because of the fact that the company operated its plant at a lower capacity in the wake of macroeconomic challenges particularly elevated energy cost and cotton crop crisis which drove up the cost of production. NATM recorded gross loss of Rs.213.56 million in 9MFY25 versus gross profit of Rs.245.27 million recorded in 9MFY24.
Curtailed operations resulted in 4.76 percent downtick recorded in administrative expense in 9MFY25. Distribution expense also dwindled by 46.86 percent in 9MFY25. Other income deteriorated by 85.54 percent in 9MFY25 probably due to lower realized exchange gain recorded during the period. NATM recorded operating loss of Rs.407.48 million in 9MFY25 versus operating profit of Rs.28.01 million recorded during the same period last year.
Discount rate cuts as well as lower outstanding borrowings resulted in 19.66 percent lower finance cost in 9MFY25. The company net loss was recorded at Rs.648.72 million in 9MFY25 versus net loss of Rs.493.56 million recorded in 9MFY24. Loss per share also elevated from Rs.23.21 in 9MFY24 to Rs.30.50 million in 9MFY25.
Future Outlook
The imposition of 10 percent universal tariff on imported goods and additional reciprocal tariffs on the countries with high trade barriers resulted in a total of 29 percent tariff imposed on Pakistan’s exports to the US market. This coupled with local energy tariff will result in further decline in the country’s textile exports which is already grappling against regional counterparts such as India, Bangladesh and Vietnam.
The company is actively seeking for ways to reduce its energy cost by installing a solar unit. Lower discount rate will also significantly reduce the company’s finance cost. NATM also plans to install open-end spinning machinery to increase its operational efficiency and minimize its production expenses.



















Comments
Comments are closed for this article.