

As NEPRA gears up for the next round of base tariff revisions, it has released the revenue requirements for power distribution companies—anchored in the Power Purchase Price (PPP) projection submitted by the Central Power Purchasing Agency (CPPA).
Developed in consultation with the Power Division and other stakeholders, the PPP for FY26 is marginally lower than last year. But with the total revenue requirement still hovering around Rs4 trillion—virtually unchanged—any hope for relief in end-user tariffs now rests squarely on government subsidies.
The CPPA’s PPP projection originally offered seven scenarios—each based on different assumptions for electricity demand, rupee-dollar parity, fuel prices, and hydrology.
NEPRA, however, requested an eighth set, which ultimately formed the basis for the FY26 PPP. This scenario assumes a modest 2.8 percent growth in demand over actual generation during July–December 2024, an exchange rate of Rs290 to the dollar, and fuel prices under standard conditions. Most notably, NEPRA has chosen to adopt low hydrology as the base case—a critical assumption that heavily influences overall power purchase costs.
The relief may be modest, but it’s still a milestone—marking the first time in years that the year-on-year change in PPP has turned negative. For context, Pakistan’s electricity PPP has doubled over the past five years, despite a noticeable shift towards a more efficient generation mix. A key contributor to the recent easing is the Rs100 billion in savings secured through the renegotiation of Independent Power Producer (IPP) contracts.
Breaking it down, 63 percent of the Rs25.98/unit PPP stems from capacity charges, while the energy component hovers around Rs9/unit. Factoring in the allowed 11 percent transmission and distribution (T&D) losses pushes the effective PPP to Rs29.6/unit. Add to that Rs3.3/unit for the wire business margin, Rs0.56/unit for distribution margin, and Rs0.49/unit in prior year adjustments—and the total revenue requirement for DISCOs lands at Rs34/unit.
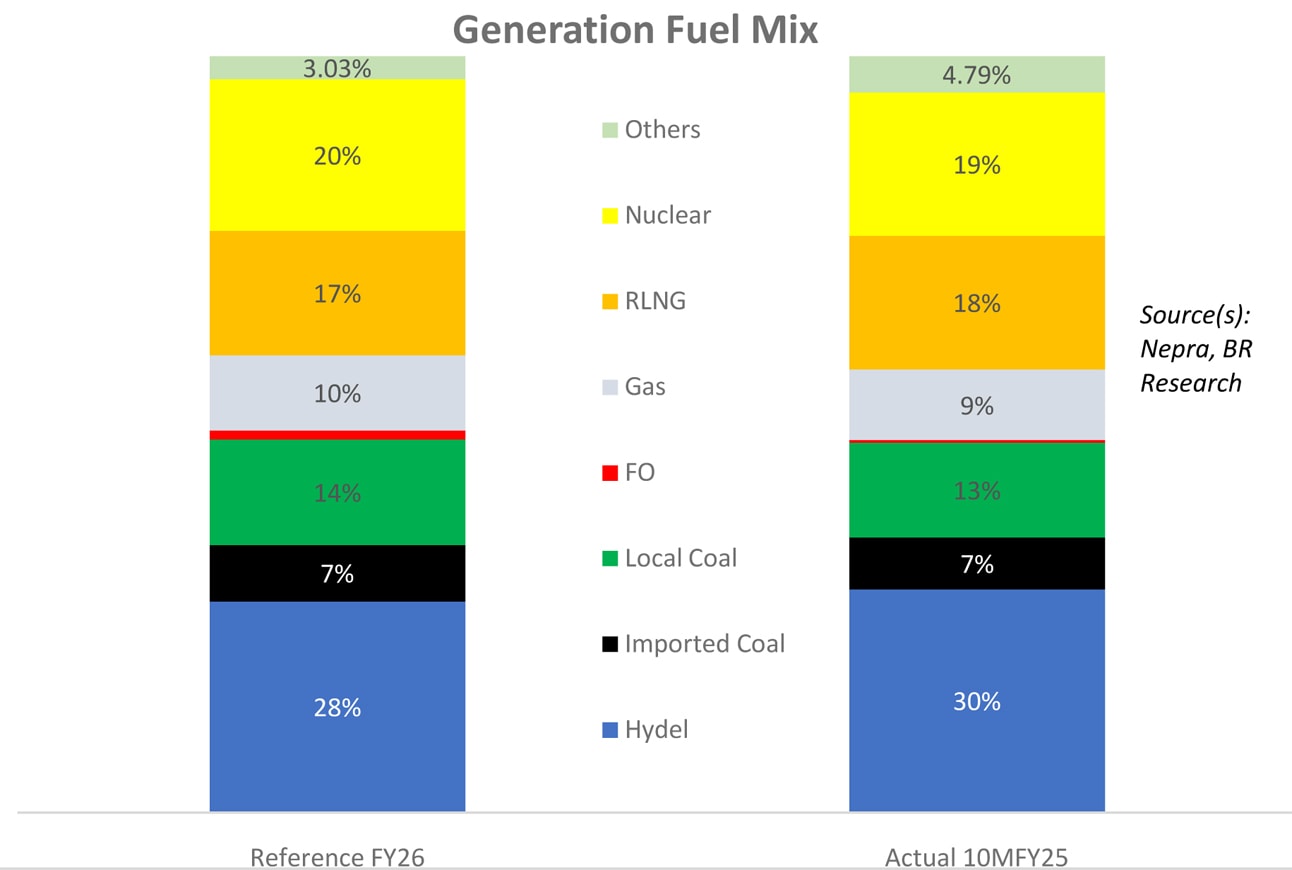
Unlike in FY23, the reference generation mix for FY26 aligns more closely with ground realities, with thermal generation now assumed at 27 percent—down from 32 percent last year. Hydel output is projected at 35.9 billion units, roughly 10 percent lower than FY24, priced at an average of Rs12/unit. NEPRA notes that the projected reduction also accounts for emerging concerns over India’s upstream water control—factored in as a risk to hydrology.
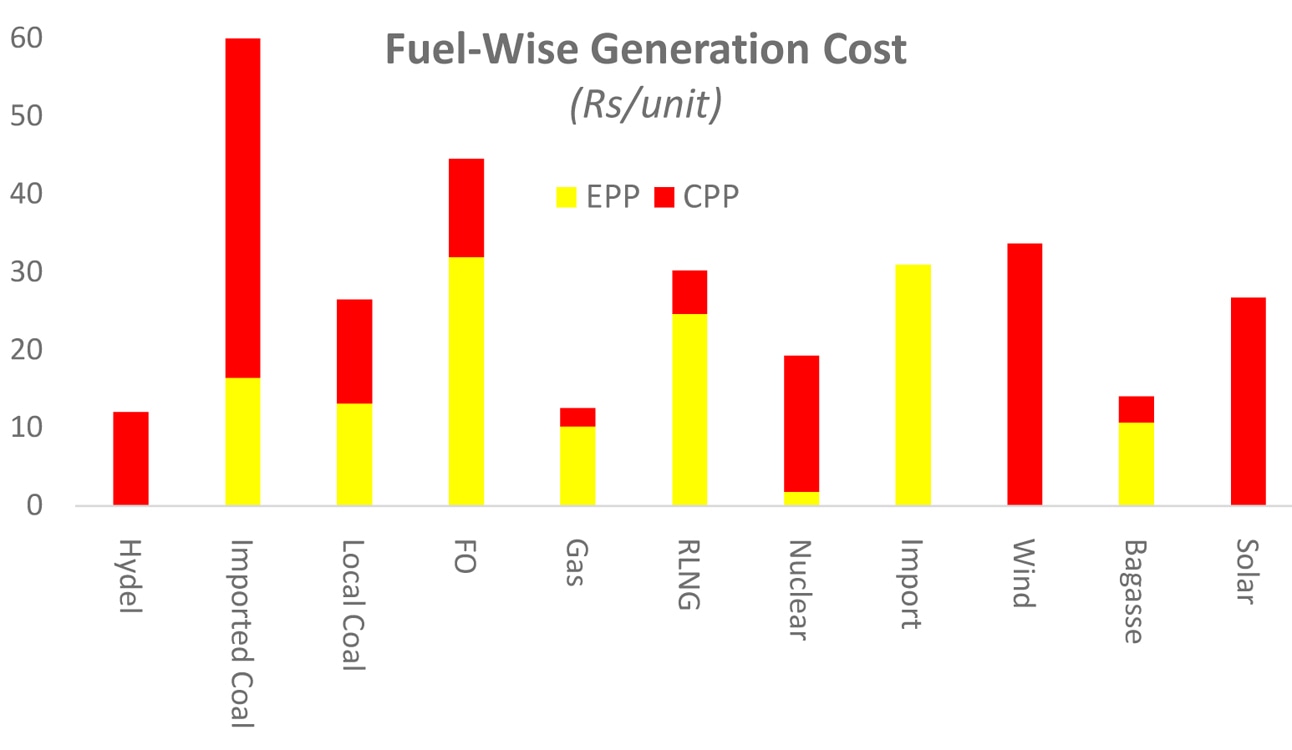
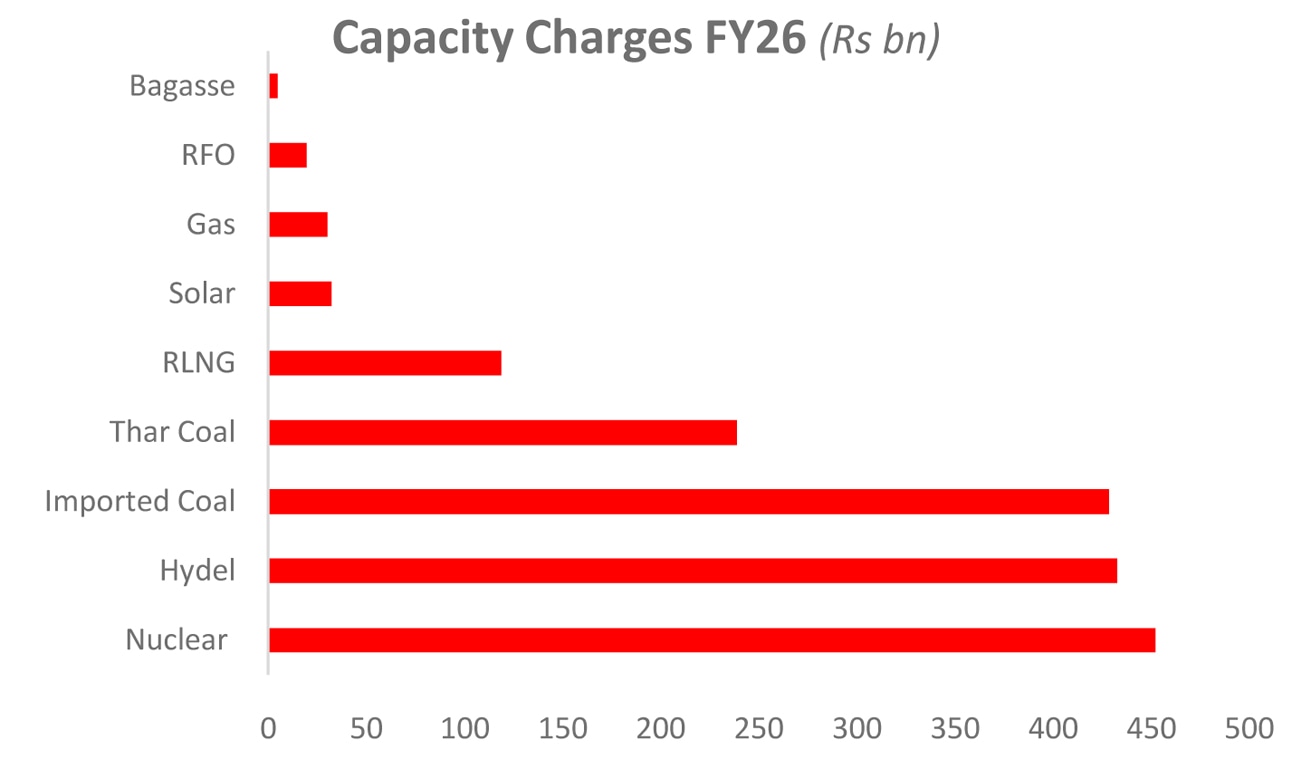
Nuclear power maintains a 19 percent share in the generation mix for the second consecutive year, priced at Rs17.5/unit—driven largely by the highest capacity charge among all sources, exceeding Rs450 billion. Imported coal continues to be the system’s most expensive burden, with a punishing unit cost of Rs61 and a meagre 7 percent generation share. Its capacity charges, at Rs428 billion, are nearly on par with hydel’s. Solar, meanwhile, comes in around the system’s average, priced at approximately Rs26/unit.
All of this assumes average T&D losses of 11 percent—translating to nearly Rs170 billion effectively vanishing into the circular debt black hole. Unlike K-Electric, no recovery allowances have been granted to discos, with recovery targets still pegged unrealistically at 100 percent. That means under-recoveries could mirror T&D losses, adding yet another layer to the circular debt pile. Meanwhile, the Debt Servicing Surcharge (DSS) remains in place—ensuring that honest bill payers continue to foot the bill (for next six years at least) for past loans taken in the name of clearing circular debt, even as fresh debt quietly accumulates.


Comments
Comments are closed for this article.