


Ellcot Spinning Mills Limited (PSX: ELSM) is part of the Nagina Group of Companies. The former was set up as a public limited company under the repealed Companies Ordinance, 1984 (now, Companies Act, 2017). The company manufactures and sells yarn at its manufacturing facility located in Kasur, Punjab.
Shareholding pattern
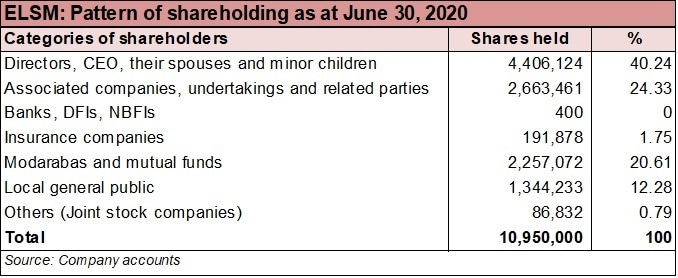
As at June 30, 2020, over 40 percent shares are owned by the directors, CEO, their spouses and minor children. Within this category, majority of the shares are owned by Mr. Amin Ellahi Shaikh and Mr. Raza Ellahi Shaikh, both non-executive directors in the company. Over 24 percent shares are held under the associated companies, undertakings and related parties followed by close to 21 percent in modarabas and mutual funds. The local general public owns 12 percent shares while the remaining roughly 3 percent shares are with the rest of the shareholder categories.
Historical operational performance
The company has mostly seen a rising topline with the exception of FY15 and FY16 and more recently in FY20. Profit margins, on the other hand, bottomed out in FY16 before rising again until FY20.
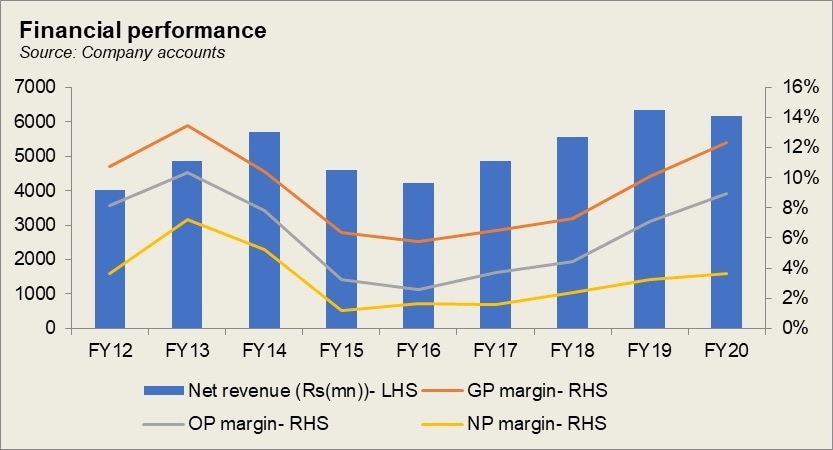
After contracting for two consecutive years, revenue in FY17 grew by 15 percent. While export sales fell drastically by 74 percent, local sales picked up by nearly 34 percent. Export sales fell partly due to depressed yarn demand and secondly due to Pakistani products being uncompetitive in the international market; the regional peers had an advantage of low cost of labor and energy that made their exports cheaper in comparison. The high cost of production within the country is also reflected in costs consuming more than 90 percent of revenue, leaving little room for profits. With cost of production marginally lower in FY17, gross margin improved to 6.5 percent for the year. But the higher taxation did not allow net margin to improve as well; it was recorded at a slightly lower 1.6 percent for the year.
Revenue continued to grow in FY18, by 14 percent, crossing Rs 5 billion in value terms. Export sales reverted somewhat to its previous levels, at Rs 1.1 billion, while local sales decreased by 5.7 percent. Export sales likely increased due to exchange rate changes that made exports competitive in the global market. The higher sales overall reduced the cost of production as a percentage of revenue to 92.7 percent, raising gross margin for the second time in a row, to 7.3 percent. With additional support coming from other income sourced from dividend earnings, and most other factors remaining more or less similar year on year, the higher gross margin trickled down to the bottomline with net margin was recorded at 2.3 percent.
Revenue increased for the third time in a row in FY19 by 14 percent. Local sales increased significantly, by 19 percent, while export sales went down marginally by 1.3 percent. Despite the currency devaluation that could make export products competitive, export sales reduced due to low yarn demand in the international market; this was due to the US-China trade war. In the local market, however, yarn prices were better that is reflected in the 19 percent growth in local sales. Cost of production was at 90 percent during the year, therefore improving gross margin to 10 percent. However, this effect did not entirely reflect in the net margin due to higher finance expense that made 4.5 percent of revenue, owing to the rise in interest rates after the election of the new government. Thus, net margin inclined slightly to 3.2 percent.
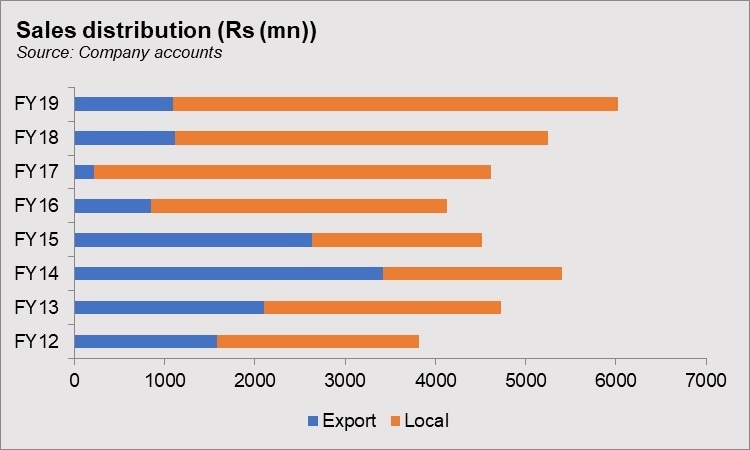
After rising for three consecutive years, topline in FY20 fell by 3 percent. Export sales decreased by over 24 percent, while local sales grew by 17 percent. The development of the Covid-19 pandemic at the end of the first half of FY20 resulted in border closures and trade disruptions. By the end of the third quarter of FY20, it entered Pakistan and was declared a pandemic by the World Health Organization (WHO). Manufacturing facilities were forced to shut down and production was brought to an abrupt halt that resulted in lower revenue. But the further reduction in cost of production as a percentage of revenue allowed gross margin to improve to 12.3 percent. This did not entirely translate into a higher net margin due to a higher tax expense. Thus, net margin was recorded at marginally higher 3.7 percent.
Quarterly results and future outlook
Revenue in the first quarter of FY21 was higher by 7.8 percent as business activities resumed and the lock downs eased. This was due to a volumetric gain. However, the significantly higher cost of production year on year as a percentage of revenue resulted in lower gross margin at 9 percent, compared to nearly 1 percent in 1QFY20. This also trickled down to the net margin that was also lower at 2 percent versus 6.3 percent in 1QFY20.
Revenue in the second quarter was only marginally lower year on year by 1.8 percent. Cost of production was a little better, therefore gross margin in 2QFY21 was higher at 13.2 percent. Net margin was also higher at 6.7 percent due to lower finance expense and taxation.
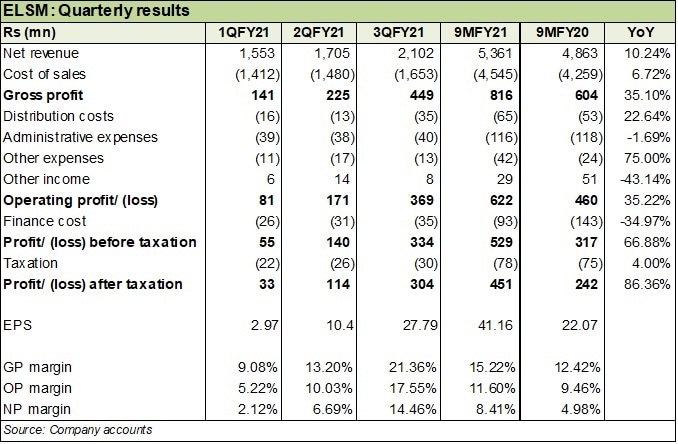
The third quarter saw revenue higher by 24.7 percent year on year. This was again due to a volumetric gain as demand for yarn increased. There was also significant reduction in cost of production that allowed profit margins to improve year on year.
The high demand seen for value added products boosted demand for yarn and the company foresees a continuing trend of growing demand. The company is also expanding production capacity. However, the industry faces challenges of raw material shortage along with rising energy costs.


Comments
Comments are closed for this article.