ISLAMABAD: Pakistan tax-to-GDP ratio decreased by 1.4 percent in 2019 compared to 2018, said the Asian Development Bank (ADB). The ADB in its latest report, "Key indicators for Asia and the Pacific 2020" stated that comparing 2018 to 2019, the government tax-to-GDP ratio rose in 11 of the 26 reporting economies.
The largest increases were observed in Nauru (2.8 percentage points), Cambodia (2.6 percentage points), and Armenia and New Zealand (1.4 percentage points each). In 15 economies, there was a decrease in government taxes as a percentage of GDP.
The largest decreases were observed in the Solomon Islands (-3.5 percentage points), Pakistan (-1.4 percentage points), and Bhutan and Palau (1.2 percentage points each).
The report noted that Bangladesh, India, and Pakistan's comparative disadvantages in the primary sector are reversed under the new revealed comparative advantage (NRCA) in 2000.
As developing economies, their agriculture and mining exports have more domestic content than those of the more industrialized economies, boosting their export shares once foreign content is netted out.
By 2019, however, only Pakistan had a comparative advantage; both traditional revealed comparative advantage (TRCA) and the NRCA for Bangladesh and India had fallen below 1.
Elsewhere, Pakistan experienced a tremendous decline in the NRCA, falling from fourth place in 2000 to the bottom 10 in 2019, it added. The pre-primary education participation rate for girls lagged behind that of boys in 14 of the 35 reporting economies, with the biggest gaps found in Palau (18.7 percentage points), Pakistan (12.7 percentage points), and the Federated States of Micronesia (9.7 percentage points).
The economies in which growth in household expenditure or income per capita lagged behind growth for the total population were Armenia, Bangladesh, Pakistan, and Sri Lanka.
In all four cases, the gap was one percentage point. From 2000 to 2019, all 48 reporting economies recorded a decline in their Red List Index score, indicating greater extinction risk. The largest declines during the review period were noted in Palau (down from 0.91 in 2000 to 0.73 in 2019), New Zealand (0.71 to 0.62), and Pakistan (0.94 to 0.86).
Comparing 2010-2018 to 2000-2009, the average annual value (in constant 2018 United States dollars) of financial and technical assistance committed to developing economies increased in 35 of the 41 economies of Asia and the Pacific with available data.
Indonesia ($1,443 million), Afghanistan ($1,302 million), and Pakistan ($938 million) received the largest average amounts of annual financial and technical assistance during 2010-2018.
In absolute terms (in constant 2018 United States dollars), Indonesia ($708.6 million), Afghanistan ($572.9 million), and Pakistan ($555.4 million) received the largest increases in financial and technical assistance from 2000-2009 to 2010-2018.
The report further stated that Pakistan and Malaysia reported the largest increases in the mean number of years of schooling for girls during the review period. Both economies posted increases of 2.3 years, followed by Fiji (1.7 years).
For boys, the largest increases in the mean number of years of schooling occurred in Pakistan (2.2 years), Bangladesh (1.7 years), and Fiji (1.5 years).
In 2019 (or the most recent year for which data were available), gross capital formation as a percentage of the GDP ranged from a low of 15.6 percent in Pakistan to a high of 56.6 percent in Nepal, where major infrastructure investments are ongoing under a program of national pride projects (Poudel 2019).
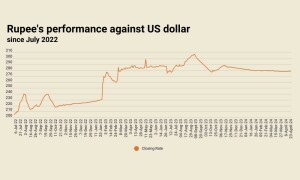
Comparing 2019 to 2018, inflation rose the most in Nauru (3.4 percentage points) on higher alcohol and tobacco tariffs and due to disruptions to shipping, and in Pakistan (3.4 percentage points) on a sharp depreciation in the country's currency.
Aggregate remittances to economies in Asia and the Pacific increased for the third consecutive year in 2019, reaching $317.5 billion.
The region's top five recipients of remittances in 2019 were India ($83.1 billion), the PRC ($68.4 billion), the Philippines ($35.2 billion), Pakistan ($22.5 billion), and Bangladesh ($18.3 billion).
In 2017, the total amount of forested land increased in 16 economies of Asia and the Pacific, while decreasing in 15 economies.
The region's leaders in terms of reforestation in 2017 were Taipei, China (4.5%); the Philippines (3.1%); Azerbaijan (2.4%); and the Lao PDR (1.0%). The highest levels of deforestation occurred in Pakistan (2.8%), Myanmar (1.8%), Timor-Leste (1.6%), and Cambodia (1.3%).
Copyright Business Recorder, 2020


Comments
Comments are closed.