Pakistan''s total imports touched $16.37 billion during 10 months (July-April) of the ongoing fiscal year 2004-05 with machinery occupying a major share of $4.52 billion (27.6 percent). Total imports showed an increase of 36.36 percent against $12 billion during the corresponding period last year. A cursory look at the import trade bulletin issued here by the Federal Bureau of Statistics (FBS) indicates that machinery group during the period under review depicted an increase of 57.42 percent over the corresponding period last year, which surged to $4.52 billion this year as against $2.87 billion.
Among this group, main import sector is the road transport sector that imported motor vehicles worth $807.8 million against $549.5 million last year, showing a rise of 47 percent.
The textile sector was second in the list with machinery imports worth $752.3 million against $476.6 million last year, depicting an increase of 57.82 percent.
During this tenure, construction and mining machinery import also showed a quantum jump of 48.46 percent by buying machinery of worth $119.9 million this year, which was $80.7 million last year.
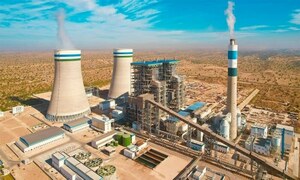
The power generation machinery also showed growth of 34.32 percent importing $301.5 million equipment compared to $224.5 million last year.
Agriculture sector imported machinery and implements worth $52.8 million against $30 million during the corresponding period last year, showing a tremendous growth of 75.93 percent.
Electric machinery and apparatus imports were $258.3 million, which was $206.4 million last year with 25.1 percent increase. Imports of machinery for office were $211.8 million against $174.3 million last year.
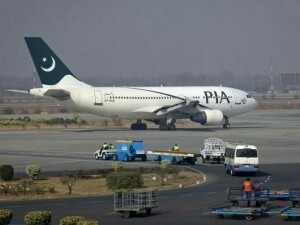
Air and water transport sector imported aircraft, ships and boats worth $142.3 million during current year against $133.14 million last year, showing increase of 6.88 percent.
However, overall, the sector, which showed a huge quantum growth in its machinery imports, was agriculture with 75 percent followed by textiles (57.82 percent); construction and mining (48.46 percent); road motor vehicles (47 percent) and power generation sector machinery import grew by 34.32 percent.
Economic managers believe that current huge growth in machinery import exhibits the state of investment in the sector, which will generate fruitful economic activities to help in jacking up the country''s development and growth.
Because of its huge machinery import, the textile sector showed tremendous results in exports of various products as compared to other sectors by earning about $6.79 billion, ie, 59 percent of the total exports during the period under review.
The bulletin further reveals that for the import of food items the country spent huge foreign exchange of $1.06 billion against $870.6 million last year, showing more than 22.48 percent increase over the last year.
Among these items, palm oil, tea, pulses, wheat and soyabean oil were the major commodities.
On the import of palm oil, country paid $539.3 million from the national exchequer during 10 months of this fiscal year against $509.1 million last year, spending 5.9 percent more followed by tea import with $194.7 million import against $170.1million, showing 14.4 percent rise; pulses: $92.5 million against 59.9 million with 53.4 percent increase; wheat: $57.6 million against 23.6 million with 143.8 percent rise and on the import of soyabean, the kitty bore burden of $48.9 million against $42.3 million last year. Besides, $28.4 million were spent on the import of milk cream food for infant against $15.6 million last year, showing 81.7 percent increase.
Dry fruit was the other item for which $34.9 million were spent as against 13.8 million with increase of 151.8 percent over last year.
On spices import, $40 million were disbursed compared to 33.3 million last year with an increase of 20 percent.
However, sugar was the item depicted an increase of 1061.8 percent over the corresponding period last year and $30 million were spent on its import against $2.58 million last year.
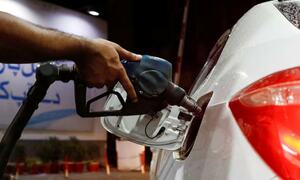
The FBS bulletin further reveals that during July-April, for the import of crude petroleum and its products the government spent $3.093 billion against $2.483 billion, showing an increase of 24.57 percent.
Under the petroleum group, during the period under review crude petroleum import stood at $1.79 billion against $1.40 billion last year, showing an increase of 20.8 percent.
While the import of petroleum products showed an increase of 27.39 percent this year with $1.79 billion imports against $1.4 billion last year.
However, the increase was not because of quantity but it was the price hike of petroleum in international markets, which made the import bill so huge.
In textile group, total import figures were $257.2 million against $214.3 million with 19.9 percent rise over corresponding period last year.
$116.9 million were spent on synthetic fiber import against $84.4 million showing an increase of 38.5 percent; synthetic and artificial silk yarn imports cost $107.9 million against $99.7 million last year showing a rise of 8.2 percent; and on worn clothing import, government spent $32.3 million against $30.2 million last year with 6.87 percent increase.
On the import of agriculture and other chemicals, the kitty bore 31.7 percent more burden compared to previous year, as this year $2.91 billion were spent on the import of these items against $2.21 billion last year.
For the import of manufactured fertiliser, $264.3 million were spent against $202.9 million last year with 30.2 percent increase; for insecticides, $114.3 million were disbursed against $87.3 million with 30.9 percent increase.
On plastic materials import, $644.1 million were spent against $435 million with 48 percent spent more this year as compared to last year.
Other major group of Pakistani import was metal for which $986.5 million were spent against $543.5 million with 81.5 percent increase over last year.
Under this head, iron and steel scrape was imported for $179 million against 73 million with 144.8 percent increase over last year, iron and steel was imported for $724 million against $402.6 million last year, showing 79.8 percent increase.
Besides, aluminium wrought and worked was also imported for $83.4 million against $67.8 million last year, depicting 23 percent increase.
Under miscellanies head, including rubber, rubber tyres and tubes, wood and cork, jute and paper products were imported for $383.9 million against $304.9 million, showing 25.9 percent increase over last year.
On rubber crude including synthetic/reclaimed was imported for $70.4 million against $55.8 million last year with 26.4 percent jump; rubber tyres and tubes import this year surged by 43 percent to $106.8 million against $74.6 million; wood and cork were imported for $23.3 million against $22.8 million depicting 13 percent increase; jute import was $33.9 million against $22.8 million with 48.6 percent; and paper and paperboard manufactured import was $149.4 million against $130.9 million last year, showing 14 percent increase.
Besides all these commodities imported during the period under review, $3.15 billion against $2.51 billion on other items showing an increase of 25.7 percent over the corresponding period last year.
Economic experts by noticing the import tendency believe if the current import trend persisted, total import bill would be substantially above the annual target of $16.7 billion for the fiscal year 2005.
BR100
7,874
Increased By
36.2 (0.46%)
BR30
25,599
Increased By
139.8 (0.55%)
KSE100
75,342
Increased By
411.7 (0.55%)
KSE30
24,214
Increased By
68.6 (0.28%)










Comments
Comments are closed.