Markets
Print 2019-09-04
Pakistan Economic Indicators
Pakistan Economic Indicators - Tuesday (September 03, 2019).
Pakistan Economic Indicators - Tuesday (September 03, 2019).
=================================================================
DAILY INDICATORS
=================================================================
                                        MONDAY           PREVIOUS
=================================================================
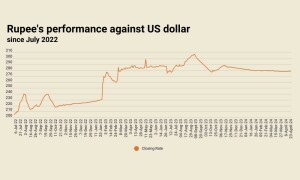
Floating Interbank Rate (Rs/$)   157.30/157.36      158.50/158.23
Rupee/US$ (kerb market)                 156.80             157.90
Karachi 100-share Index              30,520.60          31,350.01
Gold (Karachi) Rs/10 gm              76,303.38          74,674.68
-----------------------------------------------------------------
CENTRAL BANK AUCTIONS
-----------------------------------------------------------------
Treasury bill auction results:
-----------------------------------------------------------------
Cut-off yield (pct) at auction on        Aug 7            July 31
-----------------------------------------------------------------
Three-month bills                      13.7499            13.7499
Six-month bills                        13.9500            13.9500
12-month bills                         14.2499            14.2400
-----------------------------------------------------------------
Pakistan Investment Bond (PIB) auction results
-----------------------------------------------------------------
Cut-off yield (pct) at auction on       Aug 22            July 24
-----------------------------------------------------------------
Three-year PIB                         14.2500            14.2500
Five-year PIB                          13.5500            13.8000
10-year PIB                            13.1495            13.5500
20-Year PIB                   No Bids Received   No Bids Received
-----------------------------------------------------------------
WEEKLY INDICATORS
-----------------------------------------------------------------
Week ending                             Aug 17                PVS
-----------------------------------------------------------------
Total liquid forex reserves      $15,604.7 mln      $15,577.5 mln
Forex held by central bank        $8,238.7 mln       $8,264.4 mln
Forex held by commercial banks     7,366.0 mln       $7,313.1 mln
-----------------------------------------------------------------
MONTHLY INDICATORS
-----------------------------------------------------------------
                                          LAST                PVS
-----------------------------------------------------------------
Consumer price index                         -                  -
Change mth/mth (pct) July                  2.3                0.4
Change yr/yr (pct) July                   10.3                8.9
Wholesale price index July                   -                  -
Change mth/mth (pct) July                  3.1                0.3
Change yr/yr (pct) July                   13.5               12.7
Trade Balance July                         N/A                N/A
Exports July                               N/A                N/A
Imports July                               N/A                N/A
-----------------------------------------------------------------
ANNUAL INDICATORS
-----------------------------------------------------------------
FISCAL YEAR                            2019/20            2018/19
-----------------------------------------------------------------
Population (millions)                   196.17             191.71
Per capita income                       $1,516             $1,652
External debt (billion rupees)         7,795.8            6,692.5
Domestic debt (billion rupees)        16,415.2           15,437.4
Gross domestic product growth          5.3 pct           4.24 pct
Manufacturing sector growth           4.40 pct                N/A
Services sector growth                     N/A                N/A
Agricultural sector growth             4.1 pct            5.5 pct
Commodity producing sector growth          N/A                N/A
Average consumer price inflation          4.16                N/A
Fiscal deficit (pct of GDP)            5.8 pct               4.16
Trade balance (FBS July-June)     $-26,568 bln       $-19,283 bln
Exports                           $171,511 mln       $186,384 mln
Imports                           $462,763 mln       $494,721 mln
Current A/C balance                   $2.7 bln          $2.47 bln
=================================================================
* = Provisional
SBP = State Bank of Pakistan
FBS = Federal Bureau of Statistics


Comments
Comments are closed.