


Jul LSM grows 3.03pc YoY, 9.51pc MoM
- The estimated Quantum Index of Manufacturing in July 2026 was recorded at 119.13 points against 115.62 points
Pakistan's Large Scale Manufacturing (LSM) sector grew 3.03% year-on-year and 9.51% month-on-month in July 2026, driven by strong performance in automobiles and other key industries.
- Pakistan's LSM sector growth in July 2026.
- Automobile and other key industries driving LSM expansion.
- Manufacturing sectors experiencing declines during the period.
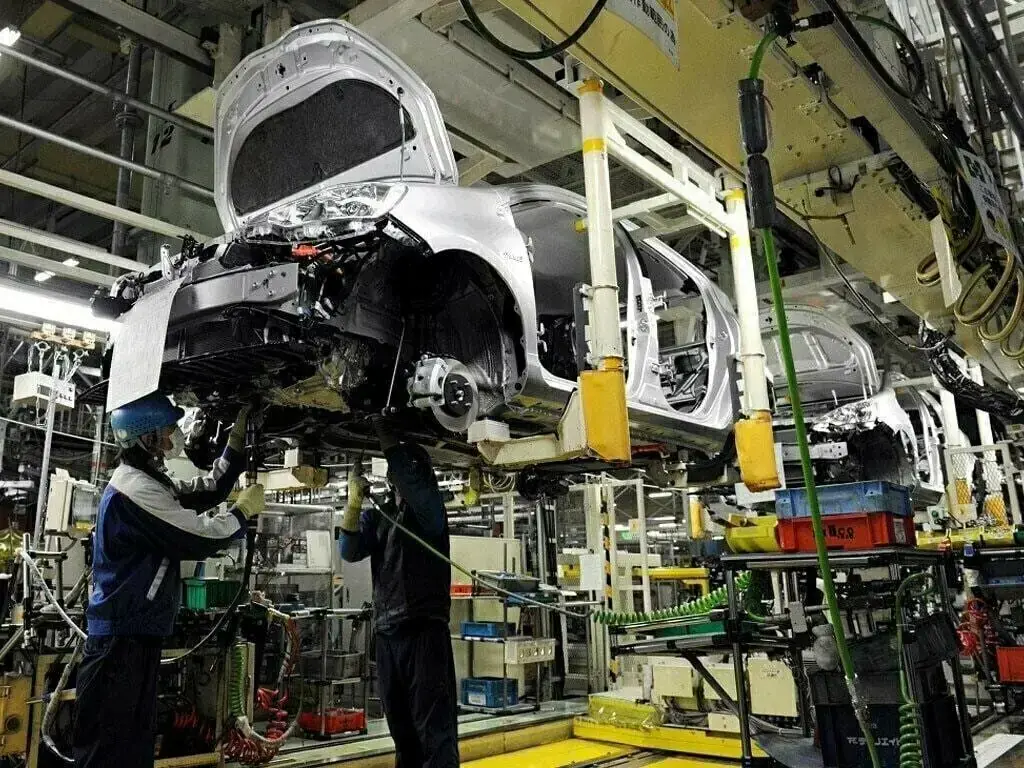
ISLAMABAD: The Large Scale Manufacturing (LSM) sector has posted a growth of 3.03 percent on a year-on-year (YoY) basis in July 2026, according to provisional data released by the Pakistan Bureau of Statistics (PBS) on Wednesday.
The estimated Quantum Index of Manufacturing (QIM) in July 2026 was recorded at 119.13 points against 115.62 points recorded during the same period last year.
The data revealed that the LSM output on a month-on-month (MoM) basis in July 2026 posted a growth of 9.51 percent as QIM jumped from 108.78 points in June to 119.13 points in July.
According to the PBS, the LSM growth is mainly driven by an impressive performance of the automobile, cotton yarn, garments, and petroleum products sectors. Automobiles remained the main driver of the QIM growth as the sector registered a remarkable growth of 57.01 percent in July and 57.77 percent during the period.
READ ALSO: FY26 LSM grows 4.98pc YoY: PBS
During the July 2026-27 period other transport equipment posted a growth of 40.22 percent, furniture 22.69 percent, tobacco industries grew up by 35.82 percent, wearing apparel posted a growth of 22.03 percent, fabricated metal 13.55 percent, furniture 10.10 percent, electric equipment 7.88 percent, computer, electronics and optical products posted a growth of 5.40 percent, non-metallic mineral products 6.52 percent 4.25 percent, wood products 2.82 percent, rubber products 1.75 percent, coke/Petroleum products 1.34 percent and leather products 0.73 percent.
However, on a YoY basis, the textile sector growth witnessed a decline of 0.45 percent, pharmaceuticals 1.24 percent, food products 0.84 percent, chemical products 0.25 percent, chemicals 0.50 percent, paper and board products 0.11 percent, iron and steel products 0.47 percent, beverages 0.45 percent, other manufacturing (football) 0.22 percent and machinery and equipment 0.03 percent.
The data revealed that on a YoY basis, tobacco sector posted a growth of 0.55 percent, wearing apparel 3.87 percent, leather products 0.01 percent, wood products growth remained unchanged, coke and petroleum products 0.11 percent, non-metallic mineral products posted a growth of 0.27 percent, fabricated metal 0.04 percent, compute, electronics and optical products’ growth remained unchanged, electrical equipment posted 0.21 percent growth, automobiles 1.91 percent, other transport equipment 0.27 percent and furniture products 0.18 percent.
Copyright Business Recorder, 2026























Comments