


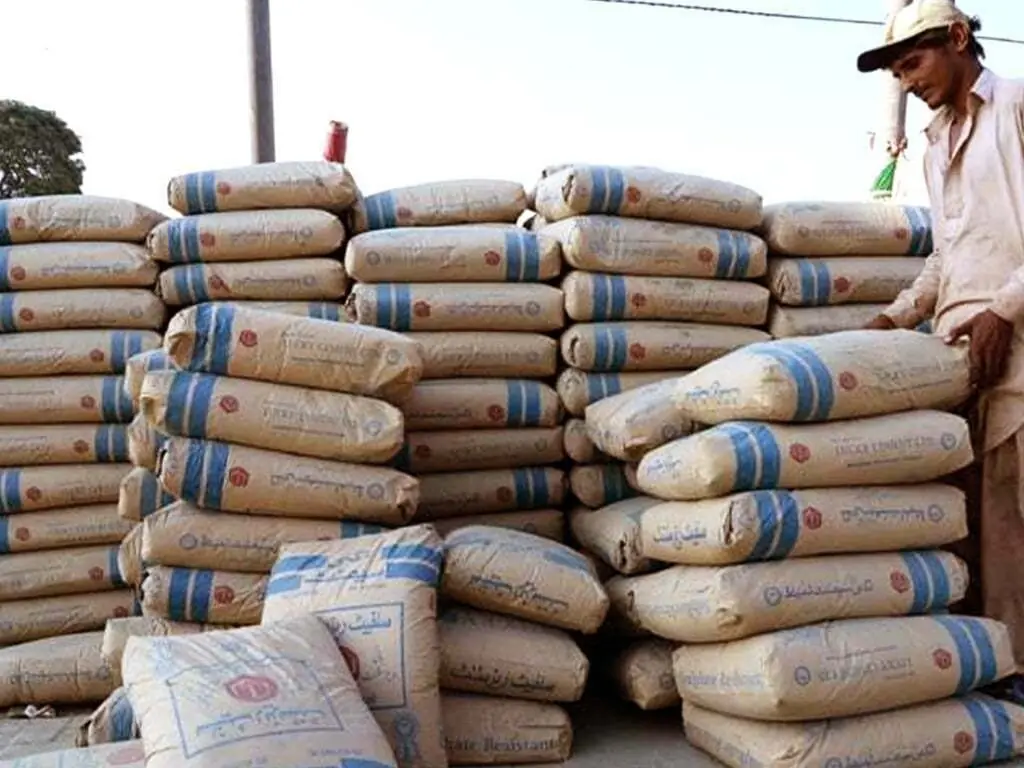
Even as the global macroeconomic environment grows increasingly volatile, the cement industry’s performance in the first nine months continues a story of domestic turnaround.
In recent years, the sector has leaned on the export crutch to maintain volume, but the narrative has shifted back to the home front.
Total offtake in 9MFY26 rose 10 percent bolstered by local demand surge of 11 percent with modest contribution of 6 percent from exports. This rebalancing has traditionally favored the bottom lines of producers who enjoy significantly higher pricing power at home than in competitive exports markets.
But despite this recovery, the industry is grappling with a capacity overhang. While average domestic monthly demand has climbed to a healthy level, roughly 3.9 million tons, ranging close to peak years and successfully climbing out of the 7-year lows seen in FY25, the scale has changed too.
Total capacity has balooned to nearly 65 million tons, up 22 percent since the high growth era of FY21. Even though plants are busier now, capacity utilization is struggling to break past the 60 percent mark.
The outlook for the upcoming quarter is also clouded by the brewing cost storm. Cement is energy intensive and the reliance on imported coal and fuel makes the sector vulnerable to geopolitical tensions.
As disruptions continue, the cost of production is set to escalate for many cement producers as coal prices surge. In the past, Pakistani cement makers have been comfortable in passing on the costs to the domestic consumer but there is only so much the market can absorb. As fuel price hikes bleed into transportation and other inputs, the purchase power of the private builder may begin to fray, potentially stalling the very recocvery the industry is currently riding.
Cross-border friction with Afghanistan continues to complicate shipments, making the domestic market’s health even more critical. While the government has launched subsidies for mortgages to keep economic optics favorable, cost pressures will dissuade even the most eager of home buyers.
Between escalating energy and fuel bills for consumers and producers, the buffer against a major macroeconomic upheavel is getting thinner by the day.


















Comments
Comments are closed for this article.