


S.S Oill Mills limited (PSX: SSOM) was incorporated in Pakistan as a public limited company in 1990. The principal activity of the company is solvent extraction (edible oil, meal). The company is engaged in the business of extraction, refining, processing and sale of semi-refined washed oil and meal.
Pattern of Shareholding
As of June 30, 2025, SSOM has a total of 5.658 million shares outstanding which are held by 1084 shareholders. Directors, CEO, their spouse, and minor children have the major stake of 52.72 percent in the company followed by local general public holding 26.55 percent of the outstanding shares of SSOM. Sikander Commodities (Private) Limited, the parent company of SSOM, accounts for 14.61 percent of its shares. Around 3.56 percent of the company’s shares are held by joint stock companies and 1.13 percent by foreign companies. Modarabas and Mutual funds hold 1.12 percent shares of SSOM. The remaining ownership is divided among other categories of shareholders.
Financial Performance (2019-25)
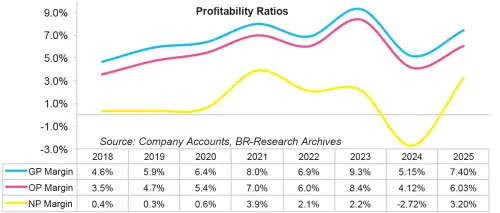
Except for a year-on-year fall in 2023 and 2024, SSOM’s topline has followed an upward trajectory over the period under consideration. Its bottomline slid from 2022 to 2024 with net loss registered in the latter year. Gross margin and operating margin ascended until 2021 and then fell in 2022 only to recover in the subsequent year where they posted their optimum values.
In 2024, both the margins fell followed by an uptick recorded in 2025. Conversely, net margin that stayed under 1 percent until 2020 posted a staggering rise in 2021 and then fell in the following year. In 2023, net margin picked up and then registered a negative value in 2024. In 2025, net margin significantly developed. The detailed performance review of the period under consideration is given below.
In 2019, SSOM’s topline grew by 11.79 percent year-on-year to clock in at Rs.3890.16 million. The sales volume of washed oil was recorded at 11,337 M.tons while the sales volume of meal and soap stood at 42,257 M.tons, down 16.4 percent and 17.5 percent, respectively. With a downtick in sales volume, increased net sales are indicative of upward price revision during the year.
Sharp depreciation of Pak Rupee as well as elevated commodity prices in the international market drove the cost up by 10.33 percent in 2019, however, SSOM was able to improve its GP margin from 4.65 percent in 2018 to 5.90 percent in 2019 through price increase. Operating expense hiked by 15.46 percent year-on-year in 2019 due to higher utility charges, travel &conveyance, and higher freight charges on account of spike in the rate of POL products and electricity tariff.
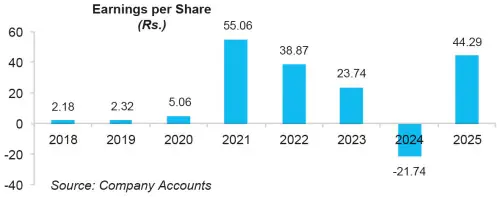
Operating profit picked up by 49.87 percent year-on-year, translating into OP margin of 4.72 percent in 2019 versus OP margin of 3.52 percent posted in 2018. Finance cost also escalated by 57.33 percent in 2019 on account of rate hike and increased borrowings to meet working capital requirements. This diluted the bottomline growth which was recorded at 6.30 percent in 2019. Net profit clocked in at Rs.13.14 million in 2019 with an EPS of Rs.2.32 versus EPS of Rs.2.18 posted in 2018. NP margin also posted a negligible downtick from 0.36 percent in 2018 to 0.34 percent in 2019.
In 2020, when many other industries were grappling against halted production and sales on account of lockdown imposed due to COVID-19, SSOM registered a healthy 28.83 percent year-on-year rise. While sales volume of washed oil slid by 1.8 percent year-on-year to clock in at 11,129 M.tons, the sales volume of meal and soap stood at 48,503 M.tons, up 14 percent year-on-year.
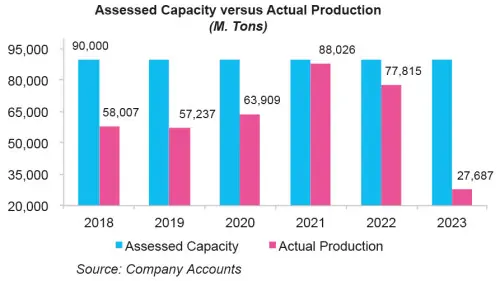
The company operated its plant at 71 percent capacity in 2020, translating into a production volume of 63,909 M.Tons. This was against the capacity utilization of 64 percent recorded in 2019. Cost of sales escalated by 28.21 percent year-on-year due to local currency depreciation. However, better sales volume of meal and soap and upward price revision translated into a GP margin of 6.36 percent in 2020.
SSOM squeezed its operating expense by 2.96 percent year-on-year in 2020 due to massive drop in freight and forwarding charges. Operating profit boasted 47.97 percent growth in 2020 with OP margin climbing up to 5.43 percent. Finance cost magnified by 36.84 percent year-on-year in 2020 which was the consequence of increased short-term borrowings to meet working capital requirements.
Nevertheless, bottomline registered a staggering 117.94 percent year-on-year growth in 2020 to clock in at Rs.28.63 million with an EPS of Rs.5.06 and NP margin of 0.57 percent.
SSOM posted a splendid topline growth of 60.38 percent in 2021. This resulted in net sales of Rs.8037.75 million. The sales volume of washed oil and meal and soap showed significant growth of 29 percent and 36 percent, respectively.
This translated into sales volume of 14,371 M.Tons of washed oil and 66,084 M.Tons of meal and soap in 2021. SSOM operated its plant at 98 percent capacity to produce 88,026 M.tons of product. Cost of sales hiked by 57.61 percent year-on-year in 2021, yet company’s robust sales volume and pricing strategy yielded a stronger GP margin of 7.97 percent in 2021.
Operating expense mounted by 12.92 percent year-on-year in 2021 which was mainly due higher communication expense, depreciation as well as sales commission. SSOM did massive provisioning for WWF and WPPF in 2021 which inflated its other expense by 415.26 percent to clock in at Rs.35.58 million. Operating profit multiplied by 105.93 percent in 2021 with OP margin jumping up to 6.97 percent. Finance cost which was on the rise in the yesteryears slumped by 38.16 percent in 2021 on account of monetary easing.
SSOM incurred lower financing cost despite the fact that its long-term borrowings considerably hiked in 2021 for the purpose of importing Silos and Solar PV plant. SSOM’s net profit marvelouslygrew by 988.43 percent in 2021 to clock in at Rs.311.57 million. This translated into an EPS of Rs.55.06 and NP margin of 3.88 percent – the highest among all the years under consideration.
The uphill journey of SSOM’s topline continued in 2022 with 31.41 percent improvement in net sales which clocked in at Rs.10,652.35 million. The sales volume of washed oil improved by 19.42 percent to clock in at 17,162 M. Tons in 2022. Conversely, the sales volume of meal and soap was recorded at 57,784 in 2022, down 12.7 percent.
Capacity utilization of plant dropped to 86 percent in 2022 translating into production volume of 77.815 M. Tons. Steep depreciation in the value of Pak Rupee and global commodity super cycle on account of Russia-Ukraine crisis inflated the company’s cost of sales by 33 percent in 2022. Hiked cost couldn’t be completely passed on to the consumers due to their squeezed purchasing power. As a consequence GP margin plunged to 6.86 percent in 2022.
Operating expense drastically surged by 35.21 percent in 2022 due to higher utility charges, vehicle running expense and freight & forwarding charges – all pointing towards elevated prices of POL products and electricity. Operating profit could only rise by 13.23 percent in 2022 with OP margin eroding to 6 percent. Finance cost elevated by 81.18 percent year-on-year in 2022 on account of monetary tightening and increased borrowings. This drove the net profit down by 29.41 percent year-on-year in 2022 to clock in at Rs.219.93 million with an EPS of Rs.38.87 and NP margin of 2.10 percent.
Defying the uphill journey of the preceding years, SSOM’s net sales registered 41 percent year-on-year slump to clock in at Rs.6230.79 million in 2023. This was on account of a huge plunge of 67 percent and 64 percent in the sales volume of washed oil and meal and soap, respectively. This translated into sales volume of 5,628 M.Tons of washed soap and 20,656 M.tons of meal & soap in 2023.
This was the consequence of a ban imposed on the import of GMO seeds as well as general import restrictions imposed by the SBP in the wake of diminishing foreign exchange reserves of the country. The company operated its plant at 31 percent capacity which was the lowest since 2018. This culminated into a production volume of 27,687 M. Tons in 2023.
The company increased its prices in accordance with the cost rise. This resulted in an improved GP margin of 9.28 percent – the highest since 2018. SSOM also kept a check on its operating expense in 2023 which slid by 20.14 percent due to a significant drop in freight & forwarding and sales commission on account of thinner sales volume. Operating profit tumbled by 17.89 percent year-on-year in 2023, yet OP margin posted its optimum value of 8.36 percent.
Despite an unprecedented level of discount rate, SSOM was able to curtail its finance cost by 22.50 percent in 2023 by significantly trimming down its short-term borrowings. Bottomline plummeted by 38.92 percent year-on-year to clock in at Rs.134.34 million. This translated into an EPS of Rs.23.74 and NP margin of 2.16 percent.
In 2024, SSOM’s net sales further deteriorated by 27.52 percent to clock in at Rs.4516.35 million. This was the result of 37.75 percent year-on-year decline in the sales volume of meal & soap which clocked in at 12,859 M tons. Conversely, sales volume of washed oil ticked up by 15.33 percent to clock in at 6491 M tons.
The company operated its plant at 23 percent capacity resulting in the production of 20,469 M tons of product, down 26 percent year-on-year. This was due to ban imposed on the import of GMO seeds and the overall restriction on the opening of L/Cs by SBP. Cost of sales could only fall by 24.22 percent in 2024 due to a hike in the prices of raw materials, depreciation of Pak Rupee and heightened energy tariff. This resulted in 59.75 percent deterioration in gross profit in 2024 with GP margin falling down to 5.15 percent.
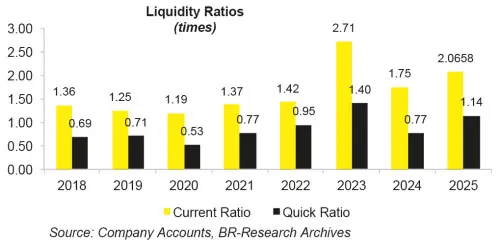
Operating expense inched up by 9.72 percent in 2024. While freight & forwarding charges slid due to thinner sales volume, operating expense mounted particularly on the back of elevated payroll expense, utility charges and vehicle running expense incurred during the year. No profit-related provisioning was done during the year resulting in zero other expenses. Other income dwindled by 53.15 percent in 2024 due to lower income on bank deposits. This was due to decline in the company’s cash & bank balances during the year, indicating liquidity constraints. Operating profit plummeted by 64.23 percent in 2024, resulting in OP margin of 4.12 percent. Finance cost escalated by 67 percent in 2024 due to monetary tightening and a considerable spike in short-term borrowings. SSOM posted net loss of Rs.122.99 million in 2024. This translated into loss per share of Rs.21.74 in 2024.
SSOM’s registered a staggering 73.35 percent year-on-year improvement in its sales in 2025 which clocked in at Rs.7828.87 million. Lifting of ban on the import of GMO seeds coupled with the decline in the prices of raw materials and stability of Pak Rupee enabled the company to operate at a capacity of 35 percent in 2025. This resulted in the production of 42,108 M tons of product, up 106 percent year-on-year. Sales volume of washed oil increased by 4.98 percent to clock in at 6814 M tons while sales volume of meat & soap mounted by 139.75 percent to clock in at 30,829 M tons in 2025. Cost of sales surged by 69.24 percent, resulting in 148.96 percent higher gross profit in 2025. GP margin rebounded to 7.40 percent in 2025. Operating expense registered 53.38 percent spike in 2025 mainly on the back of elevated freight & forwarding charges incurred during the year due to heightened sales volume.
Due to increased operations, the company also expanded its workforce from 100 employees in 2024 to 111 employees in 2025, resulting in higher payroll expense incurred during the year. Provisioning done for WWF, WPPF and ECL resulted in other expense of Rs.35.13 million in 2025, versus no other expense recorded in the previous year. Other income posted 40.28 percent growth in 2025 due to higher profit on bank deposits. While discount rate was reduced during the year, improved liquidity due to higher sales resulted in higher mark-up income in 2025. SSOM posted 153.34 percent stronger operating profit in 2025 with OP margin picking up to 6 percent. Finance cost slid by 36.46 percent in 2025 due to monetary easing and reduced external borrowings. The company posted net profit of Rs.250.63 million in 2025, resulting in an EPS of Rs.44.29 and NP margin of 3.20 percent.
Recent Performance (1QFY26)
SSOM kicked off FY26 on a robust note with a phenomenal year-on-year topline growth of 109.17 percent in the first quarter. This resulted in net sales of Rs.3018.28 million in 1QFY26. This was due to increase in the availability and demand of non GMO seeds in the international market coupled with the stability of Pak Rupee and improvement of overall economic indicators in the home market. Gross profit increased by 104.75 percent in 1QFY26; however, GP margin slightly fell to 7.75 percent from GP margin of 7.92 percent recorded in 1QFY25. Operating expense mounted by 40.32 percent in 1QFY26 due to enhancement in the company’s operations and sales volume. Other income strengthened by 114.70 percent in 1QFY26 seemingly due to higher income on bank deposits. SSOM recorded 114.70 percent improvement in its operating profit in 1QFY26 with OP margin clocking in at 7.11 percent versus OP margin of 6.93 percent recorded in 1QFY25. Monetary easing resulted in 63.40 percent less finance cost in 1QFY26. This resulted in 403.77 percent higher net profit to the tune of Rs.143.14 million in 1QFY26. EPS clocked in at Rs.25.30 in 1QFY26 versus EPS of Rs.5.02 recorded in 1QFY25. NP margin also climbed up from 1.97 percent in 1QFY25 to 4.74 percent in 1QFY26.
Future Outlook
With the lifting of import restrictions, the company may be in a better position to import soybean and continue its production to meet the growing demand. However, with the authorities’ inclination towards making the country GMO free, the company’s cost of production will rise as non-GMO seed varieties are relatively costly.


Comments
Comments are closed for this article.