



Construction workers—masons, carpenters, electricians—earn more than production workers in nearly every major LSM sector. Even after factoring in inflation, their wage index outpaces industries like textiles, sugar, and cement. Manufacturing, long seen as the engine of middle-class incomes, now lags behind daily wage labour.
Punjab’s large-scale manufacturing (LSM) wages data tells a sobering story. At first glance, the wage index shows some growth in sectors like fertilizer and tobacco. But these are exceptions, not the rule. For the bulk of LSM workers, wages have lagged behind both inflation and the statutory minimum wage, leaving real incomes in the red.
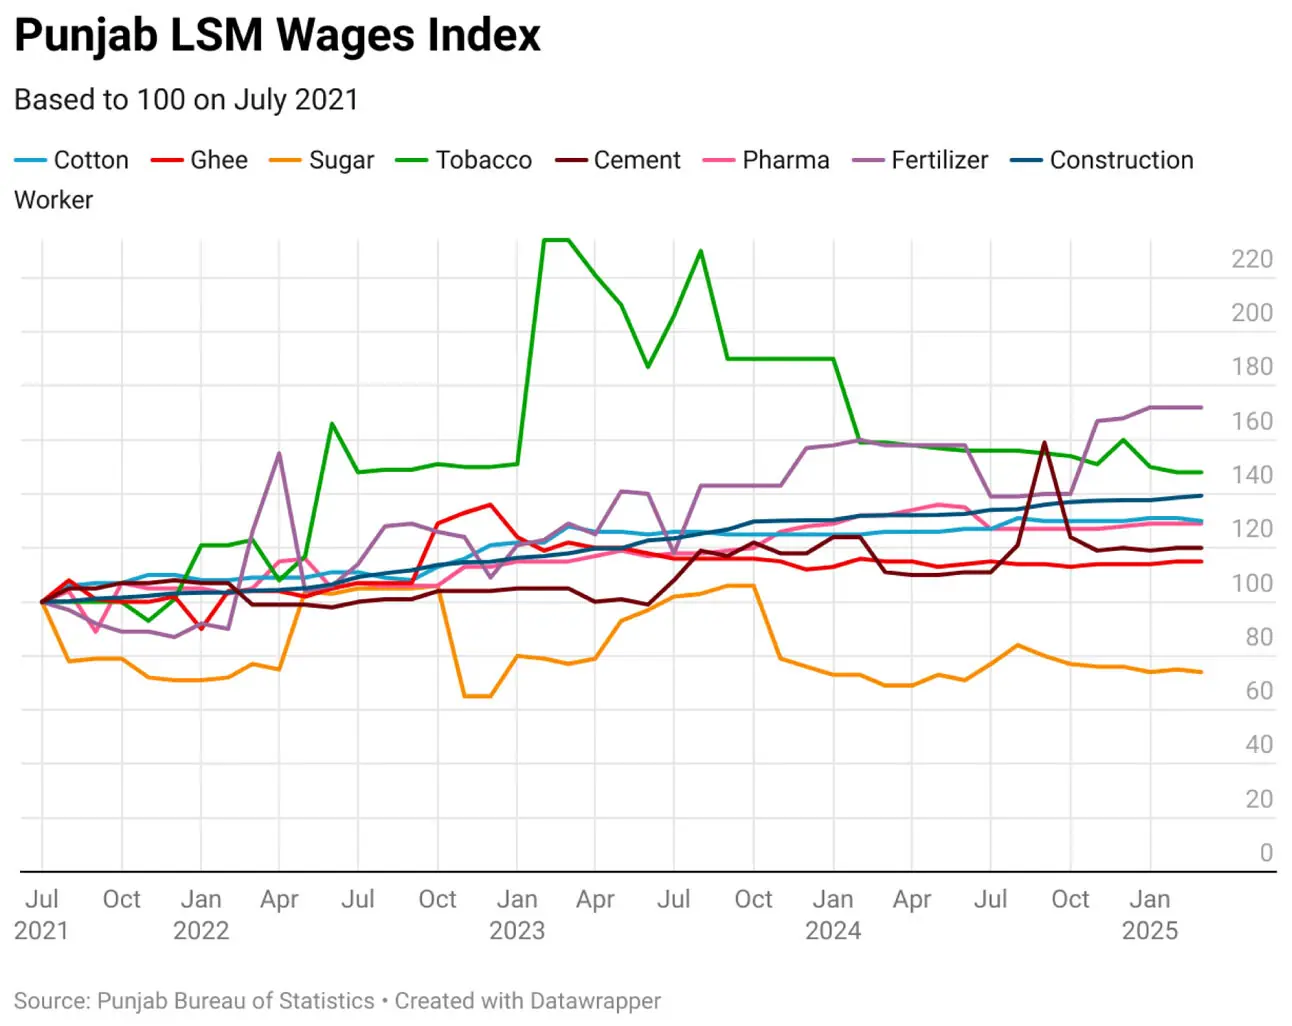
To put it in perspective: Construction worker wage index—based on daily wages of masons, carpenters, electricians, and painters—serves as a useful benchmark. Despite also recording negative real growth once adjusted for CPI, construction wages still sit above most major LSM categories.
Apart from fertilizer and tobacco, all other LSM sectors now pay less than construction work. The irony: building houses pays more than building industry.
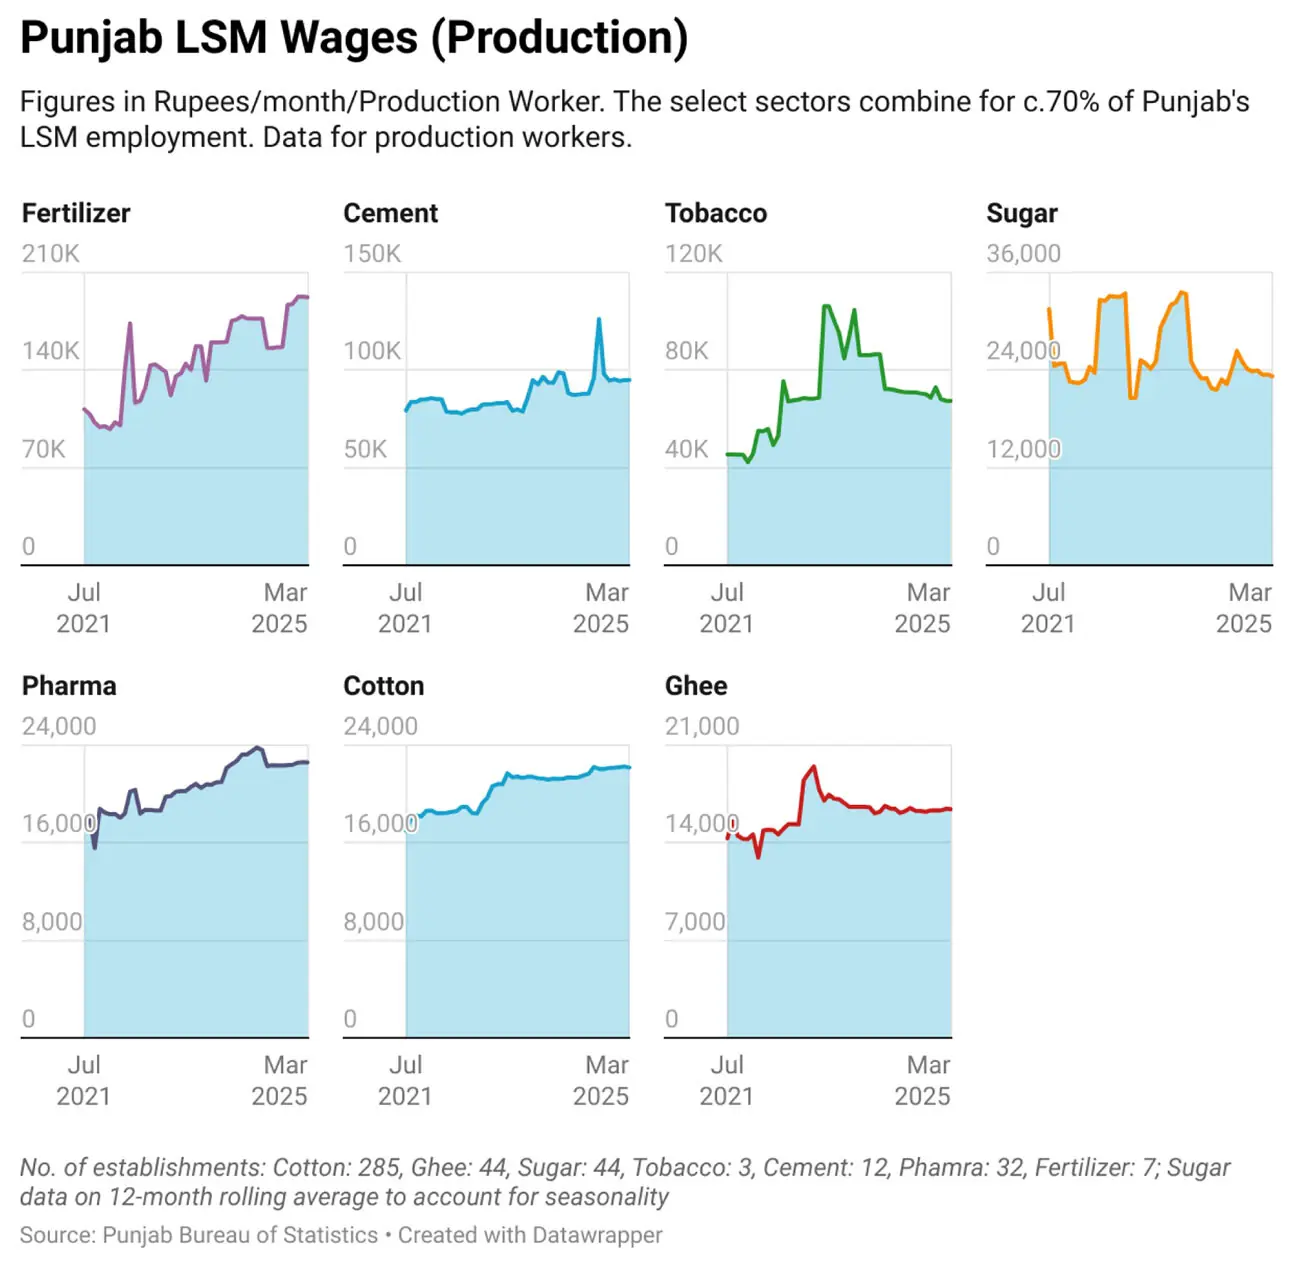
The scale of the gap becomes clear against the official minimum wage. From FY21 to FY25, Punjab’s minimum wage has climbed from Rs17,500 to Rs39,000—a 123 percent increase.
No LSM category has managed to keep pace. Even tobacco and fertilizer, the two “high flyers,” remain below this threshold. Worse, the largest employer of them all—textiles—pays its average production worker just Rs22,000 a month, far below the legal minimum. Three other major employers—sugar, cement, and pharmaceuticals—also pay under the minimum wage benchmark.
How is this possible? Loopholes. Employers skirt rules by engaging workers on daily-wage contracts, reducing official working hours, or misclassifying roles. The result: an economy where minimum wage exists on paper, but not in practice.
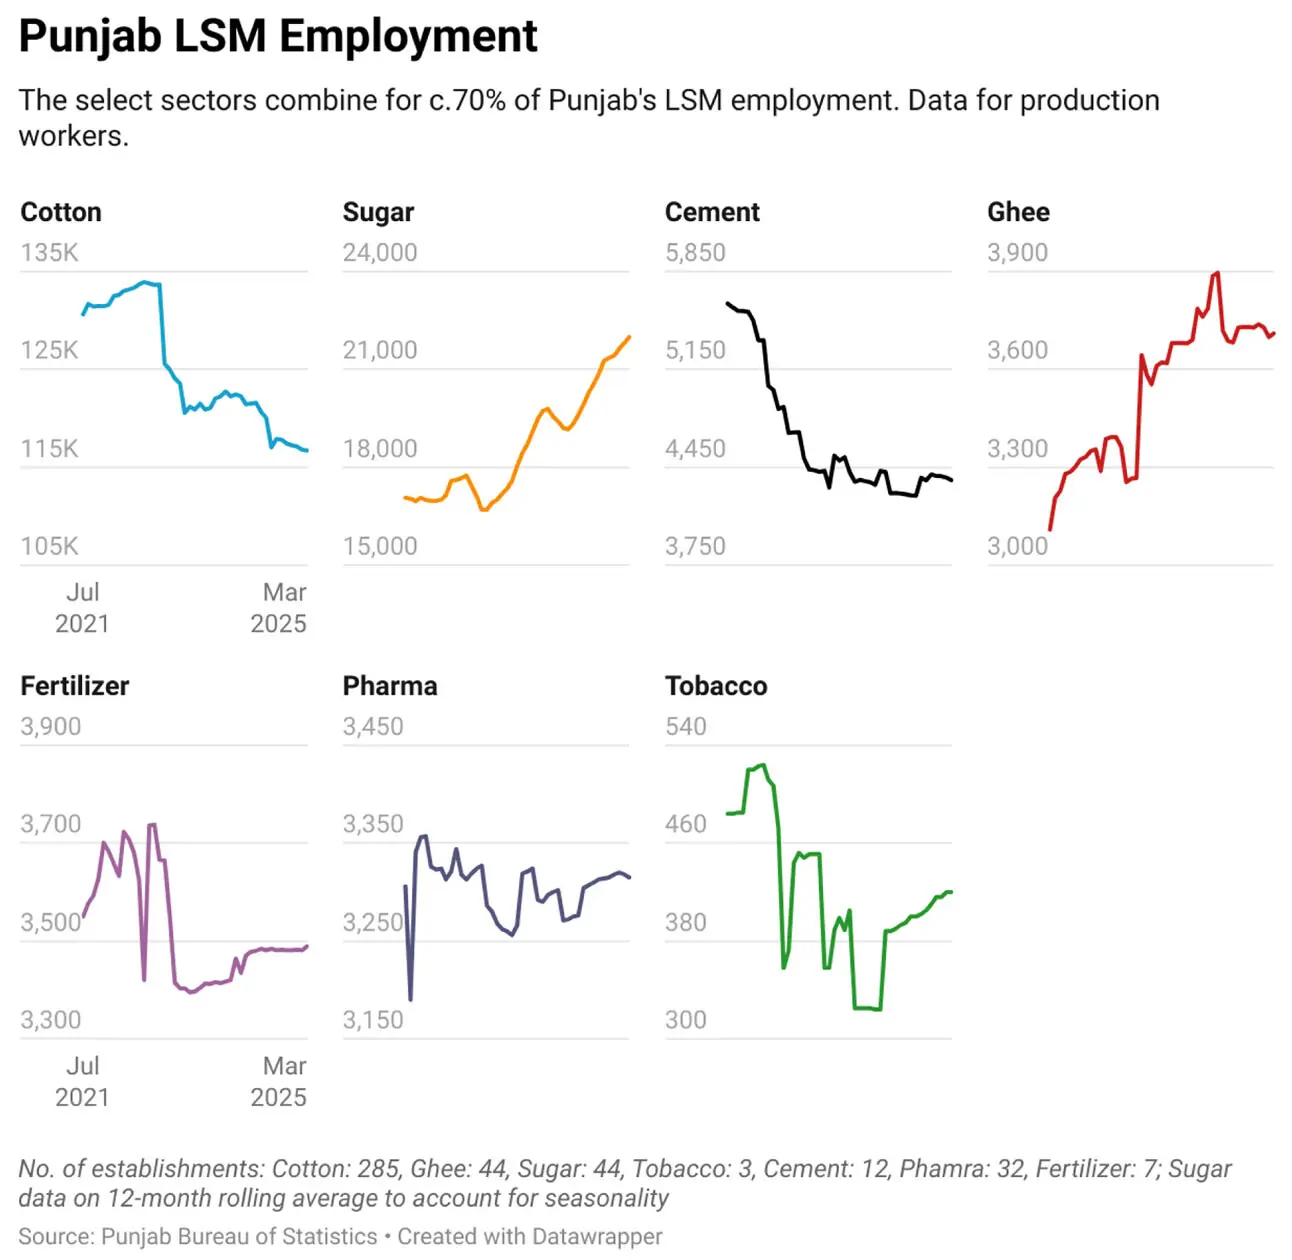
The employment-wage paradox is most striking when both datasets are viewed together. Cement, for example, has seen wages rise modestly to ~Rs100,000, but headcount has collapsed from nearly 6,000 to under 4,000 workers. Fertilizer wages have more than doubled to ~Rs150,000, but employment has edged down. In sugar, employment has surged, but wages remain erratic and mostly below construction benchmarks. Across the board, sectors with rising wages tend to employ fewer workers, while mass employers are stuck at subsistence-level pay.
The net outcome? The majority of Punjab’s LSM workforce—around 70 percent covered by the dataset—is worse off today than four years ago in real terms. The much-hyped “youth bulge” is entering a labour market that offers not just fewer jobs but also shrinking real incomes.
In more advanced economies, wage data is treated as a leading indicator of productivity, purchasing power, and social stability. In Pakistan, it barely registers in policy debates. Yet the gap between announced minimum wages and actual LSM pay scales is now too large to ignore. If the country’s largest industrial base cannot even keep its production workers at minimum wage levels, what does that say about its economic model?
For a country banking on its demographic dividend, this is not just a labour market failure—it is a demographic time bomb. Wages that do not get talked about need to become central to the conversation. Because without decent jobs that pay at least what the law promises, Pakistan’s young workforce will remain both underutilized and underpaid.
Copyright Business Recorder, 2025




















Comments
Comments are closed for this article.