

Avanceon Limited (PSX: AVN) was incorporated in Pakistan as a private limited company in 2003 and was converted into a public limited company in 2008. The company is principally engaged in the trading of products related to automation and control equipments as well as providing related technical services.
Pattern of Shareholding
As of December 31, 2024, AVN has a total of 415.023 million shares outstanding which are held by 13,054 shareholders. Directors, CEO, their spouse and minor children are the major stakeholders of AVN holding 70.50 percent shares followed by local general public having a stake of 16.48 percent in the company.
Banks, DFIs and NBFIs have a representation of 5.85 percent in the outstanding share capital of the company while Modarabas and Mutual funds hold 1.15 percent shares. About 1.11 percent shares of AVN are also held by insurance companies. The remaining shares are held by other categories of shareholders having less than 1 percent stake in the company.
Historical Performance (2019-24)
AVN’s topline has been on the upswing in all the years under consideration particularly in 2023 where the company boasted the most staggering growth. The bottomline has also registered phenomenal growth over the years except in 2023 and 2024. The onus of tremendous bottonline growth is on “other income”.
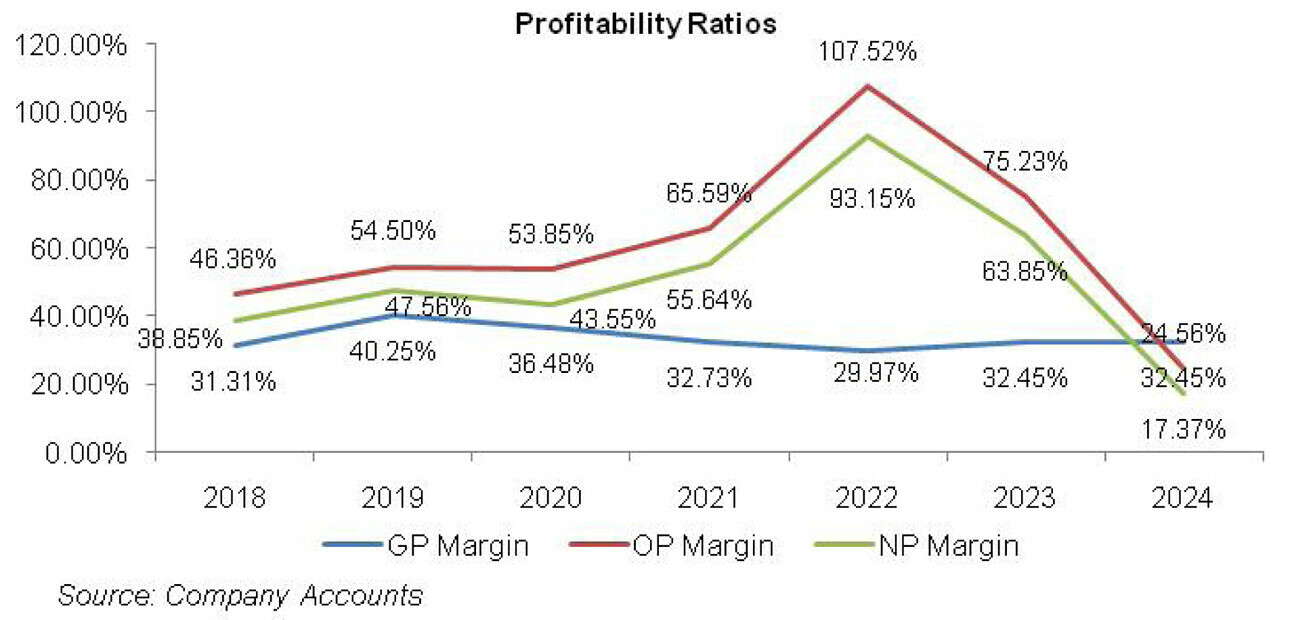
AVN’s other income is the reason why its operating and net profit margins are way above its gross profit margin in most of the years. The GP margin of the company posted an uptick in 2019 and then followed a downward trajectory until 2022 once to bounce back in 2023. AVN’s GP margin stayed intact in 2024.
Conversely, its OP and NP margin rose in 2019 followed by a dip in 2020. Both the margins strongly rebounded in the subsequent two years followed by a decline in 2023 and 2024 (see the graph of profitability ratios). The detailed performance review of the period under consideration is given below.
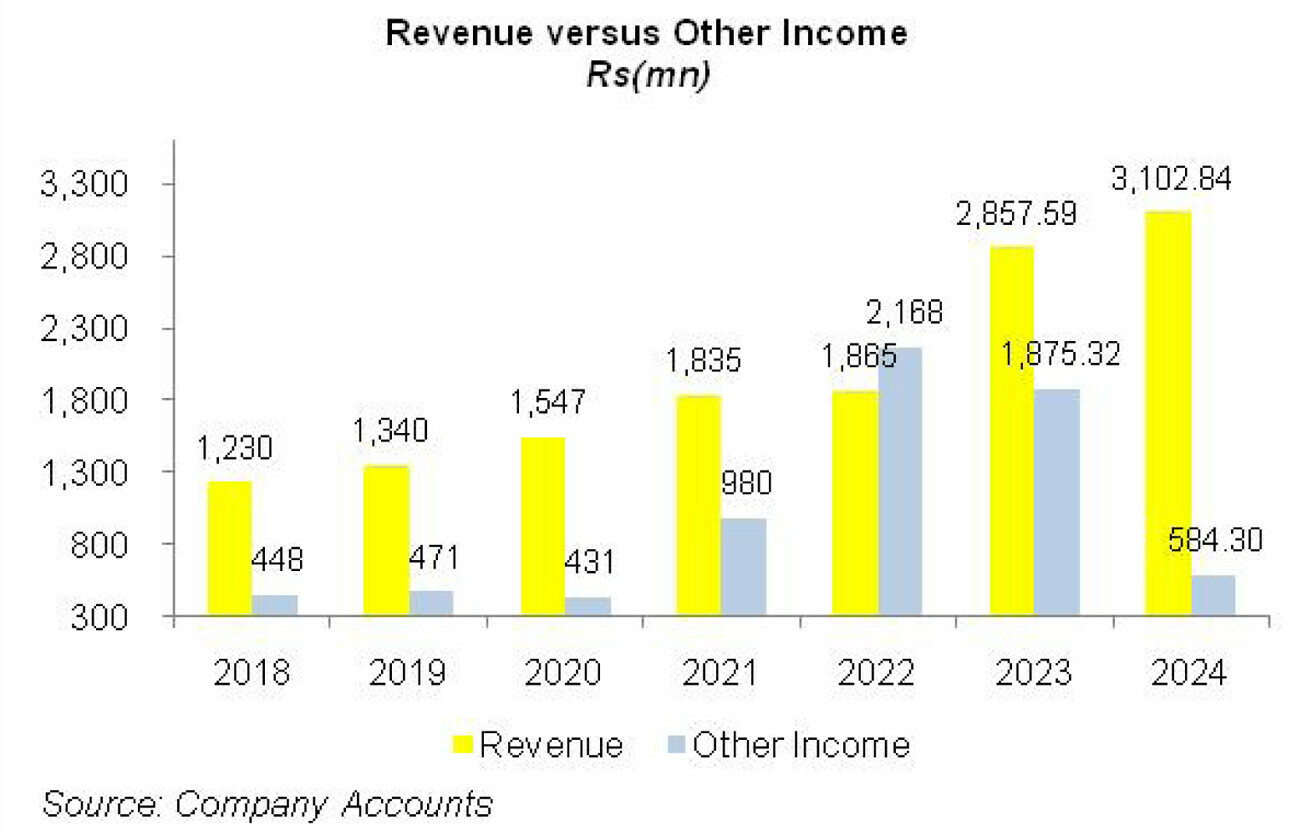
In 2019, AVN’s topline ascended by 8.95 percent year-on-year to clock in at Rs. 1340.45 million. This was on the back of export sales. Conversely, local sales slumped during the year despite 60 percent year-on-year growth in order generation. This was due to delays in some projects.
However, that provided revenue inflows in the subsequent year. The company was able to cut down its cost of sales by 5.22 percent year-on-year in 2019 which culminated into 40 percent year-on-year rise in gross profit. GP margin also surged from 31.31 percent in 2018 to 40.25 percent in 2019.
Operating expense posted 6.95 percent year-on-year growth due to massive provision booked for expected credit losses from related parties and also because of contract assets written off during the year.
Other income posted growth of 5.28 percent year-on-year in 2019 and stood at 35 percent of the company’s topline. The main sources of other income were dividend income from subsidiary companies as well as exchange gain.
On account of tremendous support which came in from other income, operating profit posted 28 percent year-on-year growth while OP margin rose to 54.50 percent in 2019 versus OP margin of 46.36 percent registered in 2018.
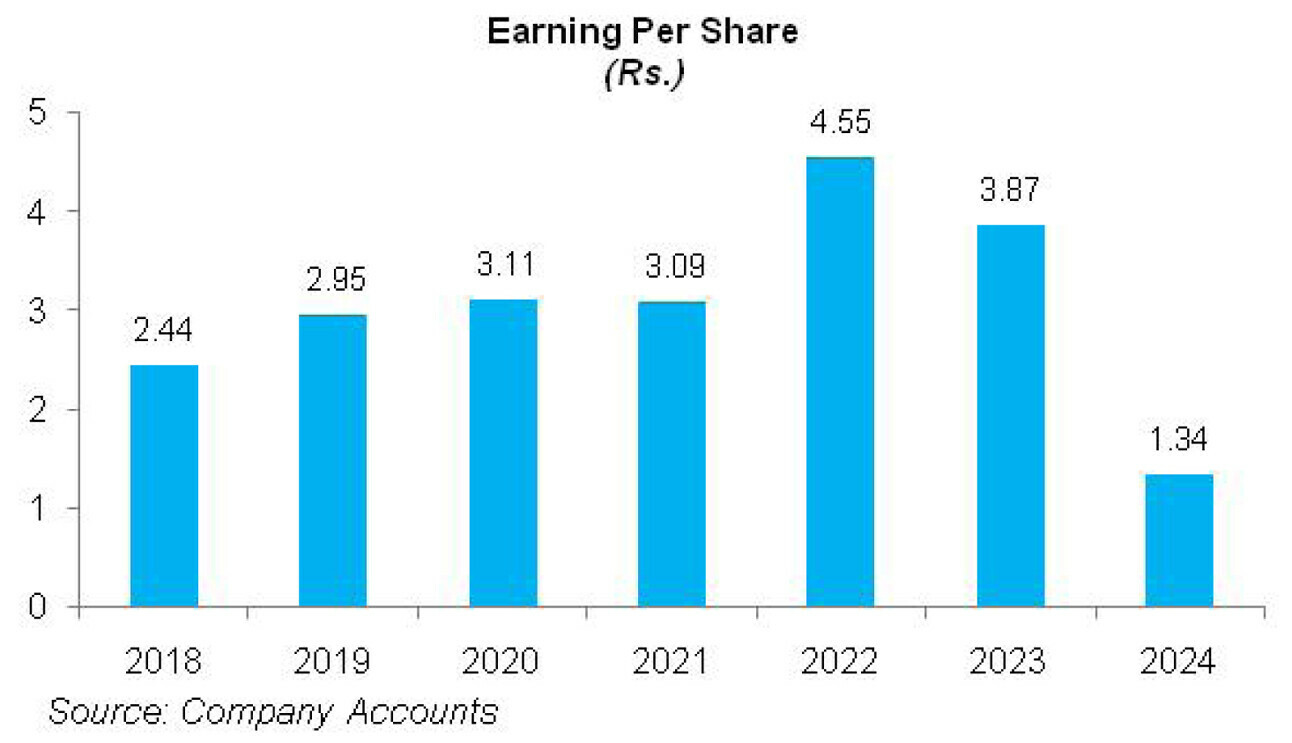
Finance cost grew by 85.34 percent year-on-year in 2019 on account of higher discount rate, however, AVN being a low gearing company, didn’t take much impact of discount rate on its bottmline which grew by 33.36 percent year-on-year in 2019 to clock in at Rs.637.468 million with NP margin of 47.56 percent versus NP margin of 38.85 percent posted in the previous year. EPS jumped from Rs.2.44 in 2018 to Rs.2.95 in 2019.
2020 brought in 15.42 percent year-on-year rise in the topline of AVN which clocked in at Rs. 1547.15 million. This came on the back of growth in both local and export sales. Project revenue which includes hardware and software automation, efficiency solution as well as SCADA (supervisory, control and data acquisition) turned out to be the major growth contributor during the year.
Cost of sales jacked up by 22.70 percent year-on-year due to installation charges and transfer of business to Octopus Digital Limited, a subsidiary of AVN. Gross profit grew by 4.61 percent year-on-year in 2020, however, GP margin shrank to 36.48 percent.
Operating expense posted a notable decline of 42.72 percent year-on-year in 2020 as unlike last year, no provision for expected credit losses was booked this year. Other income also slid by 8.63 percent year-on-year in 2020 due to a steep fall in exchange gain during the year.
Operating profit posted 14 percent year-on-year growth in 2021; however, OP margin posted a marginal downtick to clock in at 53.85 percent. Despite posting a drop in 2020, other income was robust enough for AVN to translate into OP margin in excess of GP margin.
Finance cost increased by 11.66 percent year-on-year in 2020 despite drop in discount rate as the company availed Refinance Scheme by SBP for the payment of salaries and wages and also obtained increased running finances during the year. The bottomline grew by 5.71 percent year-on-year in 2020 to clock in at Rs.673.839 million with NP margin of 43.55 percent. EPS clocked in at Rs.3.11 in 2020.
In 2021, AVN’s topline mustered 18.62 percent year-on-year growth to clock in at Rs.1835.21 million. Local sales crossed Rs.1 billion mark in 2021 and export sales also posted a reasonable growth. Cost of sales spiked by 25.61 percent year-on-year in 2021 due to greater order generation which increased the cost of materials consumed installation charges as well as salaries expense.
Gross profit grew by 6.45 percent year-on-year in 2021 but GP margin shrank to 32.73 percent. Administrative and distribution expense multiplied by a whopping 135.62 percent year-on-year in 2021 as the company booked massive provisions for expected credit losses from related parties.
Yet again, other income came to the rescue. With 128 percent year-on-year growth, other income stood at 53.4 percent of AVN’s topline in 2021 and gave a strong push to the operating profit which grew up by 44.48 percent year-on-year in 2021 with OP margin of 65.60 percent. Other income mainly comprised of hefty exchange gain as well as dividend income from subsidiary companies.
Finance cost slumped by 17.95 percent year-on-year in 2021 due to monetary easing despite the fact that the company had increased its short-term financing during the year. Net profit grew by 51.54 percent year-on-year in 2021 to clock in at Rs.1021.11 million with NP margin of 55.6 percent. EPS slightly reduced to Rs.3.09 in 2021 as AVN’s share capital grew by issuing bonus shares besides issuance of shares under employee share option scheme.
In 2022, AVN achieved only 1.6 percent year-on-year growth in its topline which was recorded at Rs. 1864.52 million. This was because local sale of goods tumbled while export sales and services continued to inch up during the year.
Cost of sales grew by 5.77 percent year-on-year on the back of higher payroll expense, installation charges, travelling related to engineering services as well as import cost. Gross profit dwindled by 6.97 percent year-on-year in 2022 while GP margin dropped to 29.97 percent.
Greater allowance for expected credit losses culminated into 91.82 percent year-on-year surge in operating expense in 2022.
Other income grew by 121.19 percent year-on-year in 2022 on the back of huge exchange gain as well gain recognized on acquisition of EmpiricAI (Private) Limited. Other income stood at 116.26 percent of AVN’s sales in 2022 and resulted in 66.54 percent hike in operating profit. OP margin staggeringly increased to 107.52 percent in 2022.
Finance cost magnified by 174.44 percent year-on-year in 2022 due to excessive hikes in discount rate coupled with an increase in lease liabilities during the year.
Bottomline grew by 70 percent year-on-year in 2022 to clock in at Rs.1736.812 with NP margin of 93.15 percent. EPS clocked in at Rs.4.55 in 2022.
AVN posted a stunning 53.26 percent year-on-year growth in its topline in 2023 which was recorded at Rs.2857.59 million. This was mainly on account of robust local sales of goods and services recorded during the year.
Cost of sales grew by 47.83 percent year-on-year in 2023, mainly on account of higher prices of raw material consumed due to inflationary pressure and decline in the value of local currency.
The company was able to pass on the onus of cost hike to its consumers which resulted in 65.94 percent stronger gross profit recorded in 2023 with GP margin ticking up to 32.45 percent.
Administrative and distribution expenses slid by 47.75 percent in 2023 as the company booked allowance for ECL as other expense in 2023. This pushed other expense up by 6225.97 percent in 2023. Other income dropped by 13.49 percent in 2023 due to high-base effect as AVN recognized gain on acquisition of EmpiricAI (Private) Limited in 2023.
The company recorded 2.73 percent slide in its operating profit in 2023 with OP margin drastically falling to 68.24 percent from its peak level of 107.52 percent attained in 2022. Finance cost grew by 36.82 percent in 2023 on account of higher discount rate. AVN’s net profit registered a plunge of 6.43 percent to clock in at Rs.1625.082 million in 2023. This translated into EPS of Rs.3.87 and NP margin of 56.87 percent.
In 2024, AVN registered year-on-year growth of 8.58 percent in its topline which clocked in at Rs.3102.84 million. The growth was mainly driven by local services rendered and export project revenue. Cost of sales also inched up by 8.58 percent in 2024 resulting in the similar growth achieved in gross profit.
GP margin stayed intact at 32.45 percent in 2024. Administrative and distribution expense escalated by 51.77 percent in 2024 due to considerable spike in payroll expense, employee share option expense as well as higher fee & subscription charges incurred during the year.
Other expense slid by 45.56 percent in 2024 as allowance of ECL booked against related parties significantly shrank during the year. Other income also dwindled by 68.84 percent as no exchange gain was recognized during the year.
Operating profit deteriorated by 60.93 percent in 2024 with OP margin sliding down to 24.56 percent. Finance cost tapered off by 11.32 percent in 2024 due to the onset of monetary easing cycle during the year.
AVN’s net profit slumped by 66.83 percent to clock in at Rs.539.096 million in 2024. This translated into EPS of Rs.1.34 and NP margin of 17.37 percent – the lowest level hit during the period under consideration.
Recent Performance (1QCY25)
During the first quarter of the ongoing calendar year, AVN posted 20.55 percent year-on-year decline in its topline which stood at Rs.423.10 million. This was due to high-base effect as large number of orders with high margins was received during 1QCY24.
Conversely, 1QCY25 remained slow on account of delays in approval from clients. However, this creates ample room for greater sales in the coming quarters. Cost of sales slid by only 1.97 percent in 1QCY25 due to inflationary pressure. This pushed gross profit down by 42.81 percent in 1QCY25 with GP margin clocking in at 32.74 percent versus GP margin of 45.48 percent recorded in 1QCY24.
Operating expense posted a paltry 0.39 percent year-on-year growth in 1QCY25. Other expense posted 92.81 percent decline in 1QCY25 as the company posted no exchange loss during the period.
Conversely, exchange gain due to stability in the value of local currency resulted in 5997.95 percent spike in other income in 1QCY25. AVN’s operating profit eroded by 26.24 percent in 1QCY25 with OP margin falling down to 21.40 percent versus OP margin of 23 percent posted in 1QCY24.
Finance cost ticked up by 1 percent in 1QCY25 despite lower discount rate. This was due to increase in outstanding liabilities during the period. AVN posted 36.53 percent plunge in its net profit which clocked in at Rs.44.68 million in 1QCY25. This translated into EPS of Rs.0.1 in 1QCY25 versus EPS of Rs.0.16 posted in 1QCY24. NP margin ticked down from 13.22 percent in 1QCY24 to 10.56 percent in 1QCY25.
Future Outlook
AVN’s expansion into new geographical markets as well as new products and services categories will drive growth in the coming times.
The acquisition of EmpiricAI has already paved its way in the advanced analytics market. Increase in export sales will be driven by strategic focus on key markets such as KSA, UAE, Qatar, Oman and Nigeria. Moreover, stability in local economic and political conditions provides impetus for improved local sales.


Comments
Comments are closed for this article.