

The trade deficit of Pakistan as a result of stagnating exports but increasing imports has created significant challenges for policymakers. The trade deficit began its upward trajectory in 2005, when it roared past $9 billion and increased three times over the previous year’s gap. Between 2013 and 2018, the trade deficit increased from $18 billion to $36 billion. This led to a burgeoning current account deficit and eventually a balance of payment crisis. This vicious cycle leads to macroeconomic instability as well as challenges on the political front. The inability to convert imports into exportable output has resulted in significant challenges as the industries are plagued with poor levels of competitiveness and lack of export growth.
On the other hand, exports from Pakistan have risen only sporadically and failed to hold on to gains. Overseas sales by domestic companies more than doubled between 2003 and 2011 and peaked at $25.3 billion. But by 2016, exports had fallen back to $20.5 billion before staggering back up to $23.8 billion last year. Studies suggest the export potential of Pakistan is approximately $36 billion. This, if achieved, could potentially save the economy from future balance of payment crisis. With import growth rates in recent years far exceeding export growth rates, a closer look at the composition in terms of different stages of production is necessary.
Analysing data from UN Comtrade, Pakistan imported $14.5 billion worth of mineral products, $6 billion worth of products in chemicals or allied industries, $4.6 billion in base metals and $9 billion of machinery and electrical appliances in 2019. This was approximately 68 percent of imports into Pakistan, worth $50.1 billion.
On the other hand, exports are limited to agro-based products such as textile, leather and vegetable products. The lack of intra-industry trade is disconcerting. Domestic industry largely fails to add value to imported intermediate goods and raw materials, instead importing intermediate goods and raw materials to serve domestic consumers. In essence, the basket of goods available to domestic consumers are uncompetitive globally, forcing policymakers to increase tariffs in the name of import substitution.
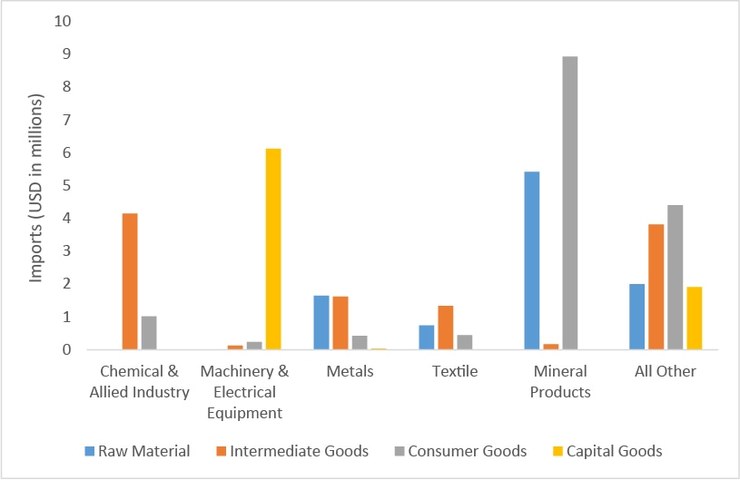
The products are disaggregated into different stages of production as classified by World Integrated Trade Solution (WITS). More than $4 billion worth of intermediate goods were imported by the chemical and allied products industry, $3 billion in raw materials and intermediate goods imported in the form of metals and $6 billion worth of capital goods in the form of machinery and electrical equipment was also imported in 2019. Textile producers, the most important export-oriented industry in Pakistan imported a much smaller amount of raw materials and intermediate goods than other import-dependent industries. Most of the consumer goods were imported in the form of mineral products, including fossil fuel.
It is important to state that the largest imports of machinery and electrical equipment at the product-level in 2019 were mobile phones, photovoltaic cells, and electric transformers, unlikely to contribute directly to export-oriented production. The imports of production enhancing machinery necessary to boost capacity of export-oriented industries such as textile machinery is relatively limited. As imports of intermediate goods and raw materials are concentrated in industries with limited exposure to export-oriented production, it is likely that imports are likely to be supporting low value-added domestic production. Trade policy must take into account the input mix that goes into production if it is to improve the competitiveness of domestic producers.


Comments
Comments are closed for this article.