




Even after the controversial repayment back in 2013 when the government took office, circular debt has remained an unbridled threat; and the threat has now blown into a full-fledged debacle as it is back to high levels. Post the IMF Programme, not only the circular debt has surged sharply to over Rs300 billion but its previous settlement (Rs480 billion in 2013) has also come under the scrutiny and objection for alleged transgressions.
Apart from finished payments under the IMF Programme, the growth in circular debt has come primarily from the unfulfillment of dues from the independent power producers, low recoveries of bills and persistently high transmission and distribution losses all of which have persevered despite tall claims. Also, the non-payment of subsidy claims has been causing disturbance to the flows of the IPPs and fuel suppliers like PSO.
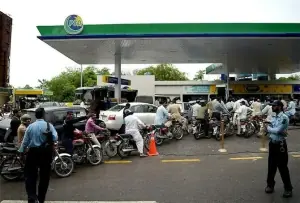
Because of its size and contribution to the market, Pakistan State Oil (PSO) is the first player to feel the tremors under such conditions. The oil marketing giant has time and again yelped for governments help to come out of the liquidity crisis. Once again, the OMC has raised the white flag signaling the possibility of a default.
While the firms earnings have remained positive, it skipped a cash dividend in 1HFY17 as it has been facing liquidity constraints. PSOs receivables have increased from Rs190 billion in 1QFY17 to RS 210 billion by the end of 1HFY17. Dreading international defaults from whoppingly increasing circular debt, the company had asked for Rs50 billion injection by the government. The government has recently decided to immediately release Rs20 billion to the state-owned company, while Rs30 billion loan for the power sector has been approved by the Economic Coordination Committee (ECC), which would consist of term finance certificates from the banking sector backed by government guarantees.
This situation is quite contrary to the highly optimistic progress of the energy sector being touted. But this is not the first time that the OMC has found itself in a liquidity crisis; the company has faced cash crunch, impending international defaults, exhaustion of credit limits, and the threat of cancellation of agreements and shortage of petroleum products in the country many times. However, the relief is always merely based on the ad hoc injection by the government rather than reformist moves, which is also probably why the circular debt keeps haunting!

















Comments
Comments are closed for this article.