




The Planning Commission has recently released the report on Poverty and Inequality Estimates for 2024-25. The report clearly indicates that both inequality and poverty have increased during the last six years. This is based on a comparison of the level and distribution of household incomes, according to the Household Integrated Economic Survey (HIES) of 2018-19 and 2024-25, respectively, undertaken by the Pakistan Bureau of Statistics (PBS).
The worrying statistic is the rise in the incidence of national poverty from 21.9 percent in 2018-19 to 28.9 percent in 2024-25. Rural poverty has increased from 28.2 percent to 36.3 percent, while it has gone up in urban areas from 11 percent to 17.4 percent.
The rise in the incidence of poverty is the reflection of a rising rate of unemployment, increasing inequality and falling real household incomes. The rate of unemployment has increased from 5.7 percent in 2020-21 to 7.1 percent in 2024-25. The average real household income has fallen by 27.5 percent in the last six years.
The Gini coefficient has been estimated to quantify the level of inequality. It has risen by 4 percent from 0.310 in 2018-19 to 0.322 in 2024-25, with a big increase in urban areas of 9 percent. There are also big differences among the provinces in the level and increase in inequality and poverty. Baluchistan is reported as having the highest incidence of poverty in 2024-25 of 47 percent. The biggest increase in inequality is also reported in Baluchistan, followed by Sindh.
The report has highlighted various causes for the worsening of the living standards of the people. The first factor is irresponsible and changing economic policies. The second cause of increased poverty has been COVID-19 in 2019-20 and the large-scale devastation caused by the floods of 2022-23. Further, the presence of IMF programmes for stabilization of the economy has led to reduction in subsidies, rise in indirect taxes and big cutbacks in development spending.
The report was presented by the Planning Minister who highlighted the need for export-led growth, focus on relatively under-developed districts and a better fiscal balance between the federal and the provincial governments. He emphasised the need for higher priority to social protection, with both cash transfers and poverty graduation programmes, coupled with the promotion of Small and Medium Enterprises (SMEs).
There is need to recognize the value of this report. Not only has it highlighted the widespread decline in living standards of the people of Pakistan but has also suggested various components of the appropriate growth strategy to reduce inequality and alleviate poverty. Hopefully, these policies will be implemented by the incumbent government.
However, there are some problems with the reported magnitudes on the level and change in the rate of unemployment and the level and magnitude of increase in inequality and the incidence of poverty in the country.
We first look at the reported rate of unemployment at 7.1 percent, rising somewhat from 5.7 percent four years ago. This increase is small when the level of demand by productive enterprises for recruiting labour has been stifled by the lack of growth in output.
However, the Labor Force Survey of 2024-25 has reported a disproportionate increase in employment in relation to the low cumulative growth in output, between 2020-21 and 2024-25, as shown in Table 1.
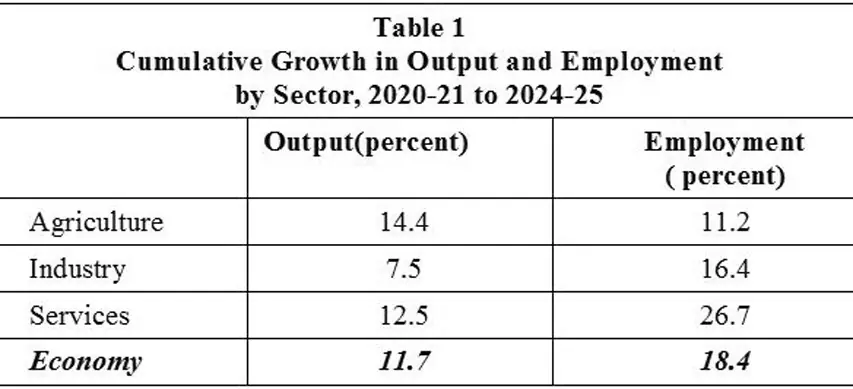
The fundamental problem is that a cumulative increase in the real GDP of 11.7 percent in these four years has led to a much bigger rise in employment of 18.4 percent, according to the Labor Force Surveys of the PBS.
Historically, increases in output in Pakistan have been accompanied by increase both in employment and in labour productivity. On average, a 1 percent increase in output is accompanied by a 0.6 percent increase in employment. However, a 1 percent rise in output in the last four years has apparently led on average to an increase of almost 1.6 percent in employment.
Therefore, the Labor Force Survey of 2024-25 has substantially overstated the level of employment. On the basis of the historical relationship between output and employment, the unemployment rate is likely to have been much higher at 13.2 percent, as compared to the reported 7.1 percent.
The Population and Housing Census of 2023 has actually revealed an extraordinary level of unemployment of 18.7 million workers, implying an unemployment rate of 22.1 percent. This is in comparison to the estimates in 2024-25 of 8.4 million unemployed and 7.1 percent rate of unemployment by the Labor Force Survey.
There is an urgent need for the Pakistan Bureau of Statistics to explain the wide divergence in the level and rate of unemployment estimates from different sources. The likelihood is high that the unemployment situation is much worse in Pakistan today than revealed by the Planning Commission report.
We turn next to estimates of the level of inequality in the report. The Gini coefficient at the country level is reported at 0.327 in 2024-25, based on the findings of the HIES of 2024-25.
However, the problem here is the big underreporting of household incomes in the HIES. The estimated national household income from the HIES is Rs 68,535 billion in 2024-25. The estimated national income is Rs 121,864 billion. Therefore, there is a very large understatement of income by the surveyed households. This is especially the case with upper income households, who are motivated to understate their incomes for tax and other reasons. Therefore, the estimated Gini Coefficient of Inequality of 0.327 is biased downwards. Research in Pakistan indicates that after adjustment for underreporting it is above 0.40.
Finally, we turn to estimates of poverty in the Planning Report. There is the estimated poverty line of Rs 8,484 per adult on a monthly basis. Accordingly, for a typical household in Pakistan, with close to four children and over two adults, the household poverty line is Rs 42,420. This ought to be the minimum wage in Pakistan.
However, even with the minimum wage somewhat lower at Rs 40,000, the Labor Force Survey reveals that wages of the employees are relatively low. The average wages are below Rs 40,000 for almost 85 percent of the employees. They are very low for skilled agricultural workers, craft and related trades workers, plant and machinery operators and elementary occupations. Therefore, a large proportion of these workers have households below the poverty line.
There is also an understatement of poverty if the other approach to estimation of the incidence of poverty is adopted in the form of multidimensional poverty. This measure has three dimensions, according to estimation of multidimensional poverty by the Pakistan Institute of Development Economics (PIDE); namely, living standards, education and health. These dimensions include 15 indicators.
Eight indicators relate to living standards, three to education and four to health. This approach to measuring poverty has the advantage of highlighting the gap in the provision of basic public services to households.
Estimates of the incidence of multidimensional poverty have been derived from the Pakistan Social and Living Standards Measurement Survey of the PBS for 2019-20 by the PIDE. The incidence of multidimensional poverty is reported as very high at 39.5 percent. This compares with the estimate of 21.2 percent using the cost of minimum basic needs approach in 2018-19.
The PIDE estimates also reveal a wide divergence between urban and rural areas. The incidence of multidimensional poverty is 17.1 percent in urban areas and as high as 51 percent in rural areas. There is also a large variation of incidence of multidimensional poverty among the Provinces as shown in the Table 2.
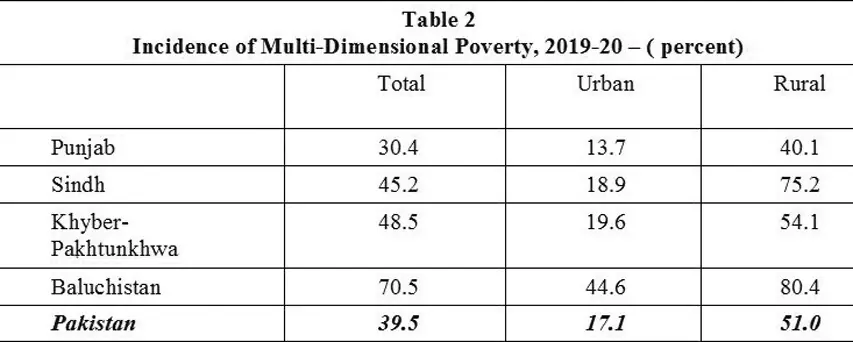
It is clear that there is a much larger divergence of poverty incidence among the provinces than as indicated in the Planning Commission Report. It is at an extremely high level of over 70 percent in Baluchistan.
Therefore, the rate of unemployment, extent of inequality and incidence of poverty are likely to be significantly higher than the magnitudes reported by the Planning Commission. The estimate of the rate of unemployment at 13.7 percent and the incidence of poverty at almost 40 percent highlight a crisis in the living standards of the people of Pakistan.
The time has come for declaration of a national economic emergency. Based on a broad-based national consensus there is need to identify and implement deep and wide-ranging structural reforms. Some of these reforms have already been identified by the Planning Commission in its report.
Copyright Business Recorder, 2026
The writer is Professor Emeritus at BNU and former Federal Minister




















Comments
Comments are closed for this article.