

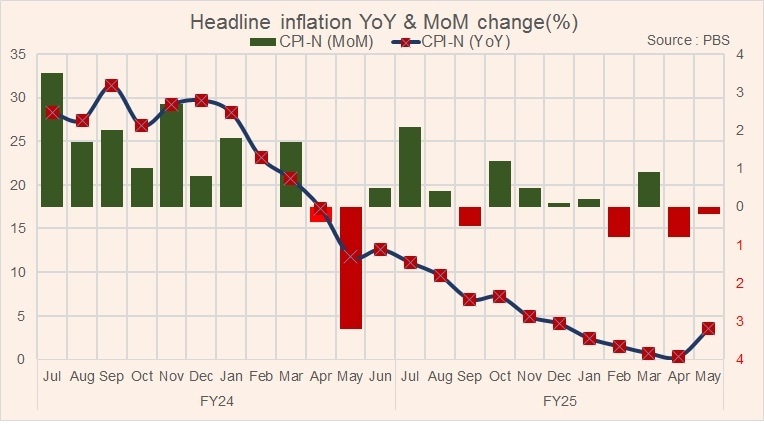
Headline inflation finally reversed its trend, rising to 3.5 percent in May 2025 compared to 0.3 percent in the previous month and 11.8 percent in the same period last year. This change is largely driven by the base effect—over the past eleven months, a high base effect contributed to lowering the headline number. Now, with the full cycle complete, the low base effect has come into play, pushing inflation upward.
However, due to negative month-on-month (MoM) inflation in six out of the past twelve months, the increase in inflation—despite the base effect reversal—remains below the SBP’s medium-term target range of 5 to 7 percent. It is likely to stay under 5 percent for the remainder of the calendar year.
In May, on abasis, month-on-month basis, inflation declined by 0.2 percent. This was driven by falling prices in food (-0.2%), transport (-0.2%), recreation and culture (-4.7%), and housing and utilities (-1.2%). These declines more than offset increases in clothing (1%), education (0.7%), and miscellaneous categories (1.7%).
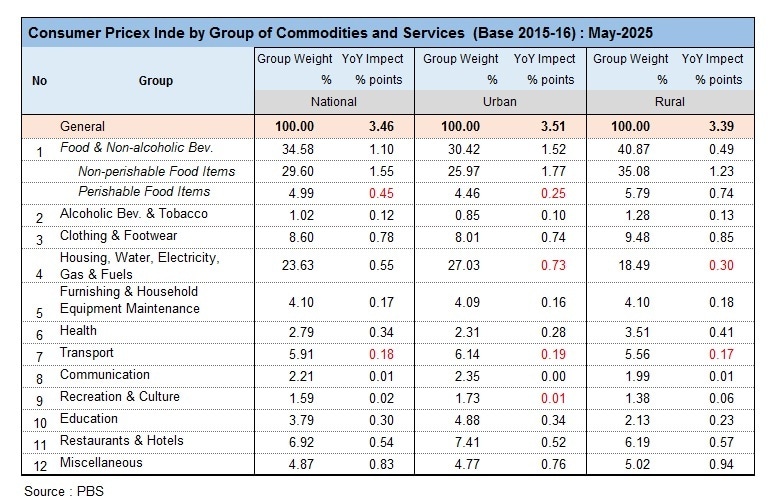
One of the most notable declines was seen in electricity charges. May marked the seventh consecutive month of falling electricity prices, with a 7.0 percent drop. This decrease is due to the implementation of a negative Rs1.55/kWh Quarterly Tariff Adjustment (QTA) for 3QFY25, which began in May, adding to the existing Rs1.9/kWh QTA.
Within the food category, falling wheat prices had a significant downward impact—dropping 7.3 percent MoM. This decline also reduced the prices of wheat flour and wheat-based products and had a cascading effect on other food items. Additionally, prices of perishable items like tomatoes and onions also saw notable declines.
Core inflation, however, has not declined at the same pace. It stood at 7.8 percent in May (urban core: 7.3%, rural core: 8.8%) compared to 8 percent in April and 14.2 percent in May last year.
The overall decline in inflation is primarily due to falling food prices—partly because of the absence of a wheat support price—and to a broader decline in global commodity prices. Energy prices, particularly fuel and electricity, are also decreasing, supported by a stable currency amid the global commodity price downturn.
However, second-round effects of the earlier inflation surge are still in play. As a result, categories like health, education, and miscellaneous remain in double digits, and clothing and footwear are approaching that threshold due to seasonal Eid-related demand pressures.
A divergence between urban and rural inflation is emerging. In May 2025, urban food inflation stood at 5.3 percent compared to just 2.1 percent in rural areas. Conversely, in non-food categories, urban inflation was 2.4 percent while rural inflation was 4.6 percent. Despite these differences, the overall headline inflation rates were similar: 3.5 percent in urban areas and 3.4 percent in rural areas.
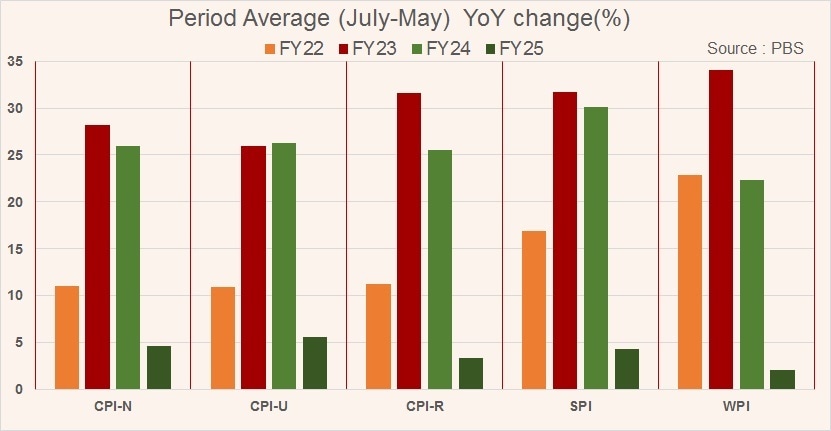
Demand-side pressures and economic activity levels vary across regions. Overall, headline inflation for the first eleven months of FY25 (11MFY25) averaged 4.6 percent, a sharp decline from 24.5 percent during the same period last year. The trend is expected to remain steady, and barring any external or climate-related shocks, inflation is projected to stay below 5 percent in 2025. This gives the SBP room to further cut interest rates.


Comments
Comments are closed for this article.