




Pakistan Bureau of Statistics (PBS) finally came up with rebasing of Quantum Index of Large-Scale Manufacturing Industries. It took a decade coming, but it is always better late than never. The first glance tells hard work has been put in by the PBS, which is commendable, and the LSM is now more representative and inclusive than previously.
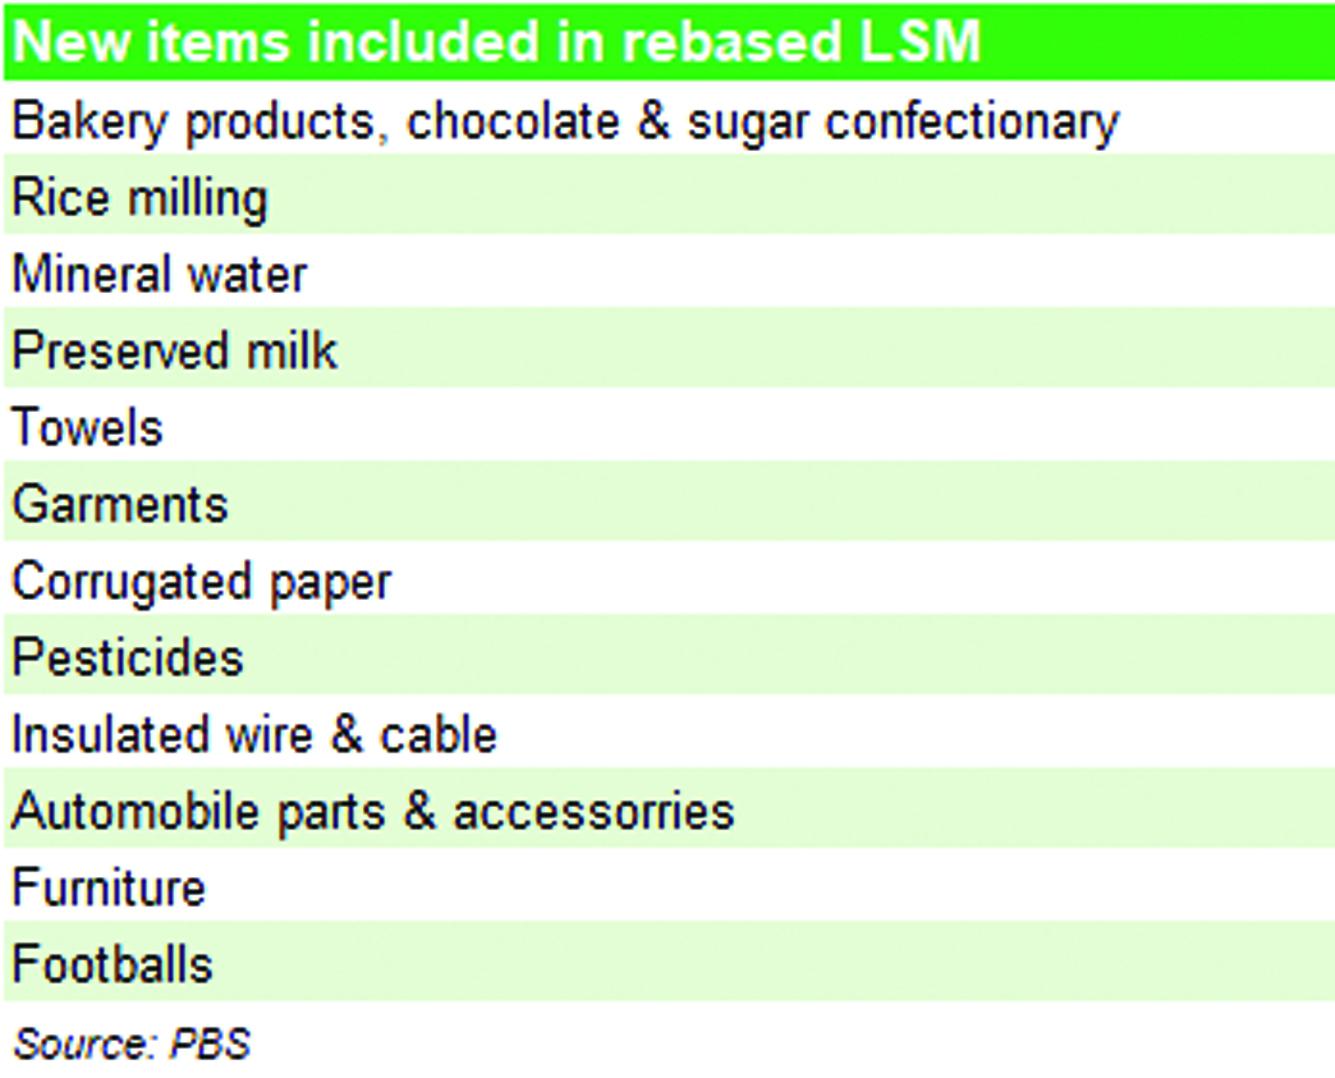
Firstly, the scope of the LSM is much expanded, where the number of establishments covered in the Census Manufacturing Index has gone up to ~42,500. This is a five-fold increase in the number of reporting establishments from the 2005-2006 bases – and the highest ever increase, even accounting for a considerable lag.
Of the total frame, PBS managed to extract quality response from nearly 24,000 manufacturing establishments – three times higher than the establishments used to derive index weights in the previous base. The total numbers of items in the basket have also increased from 112 in the old base to 123, as the LSM is now representative of 78 percent of all establishments, up from 70 percent in the 2005-06 bases.
The most notable inclusion is that of wearing apparel as a separate group, with a considerable weight of 6.1 percent. Recall that textile’s representation in LSM had long been a subject of criticism from observers, as the scope was limited to cotton yarn only. The weight assigned to wearing apparel is closer to big industries such as chemicals and petroleum, showing better representation of the textile value chain.
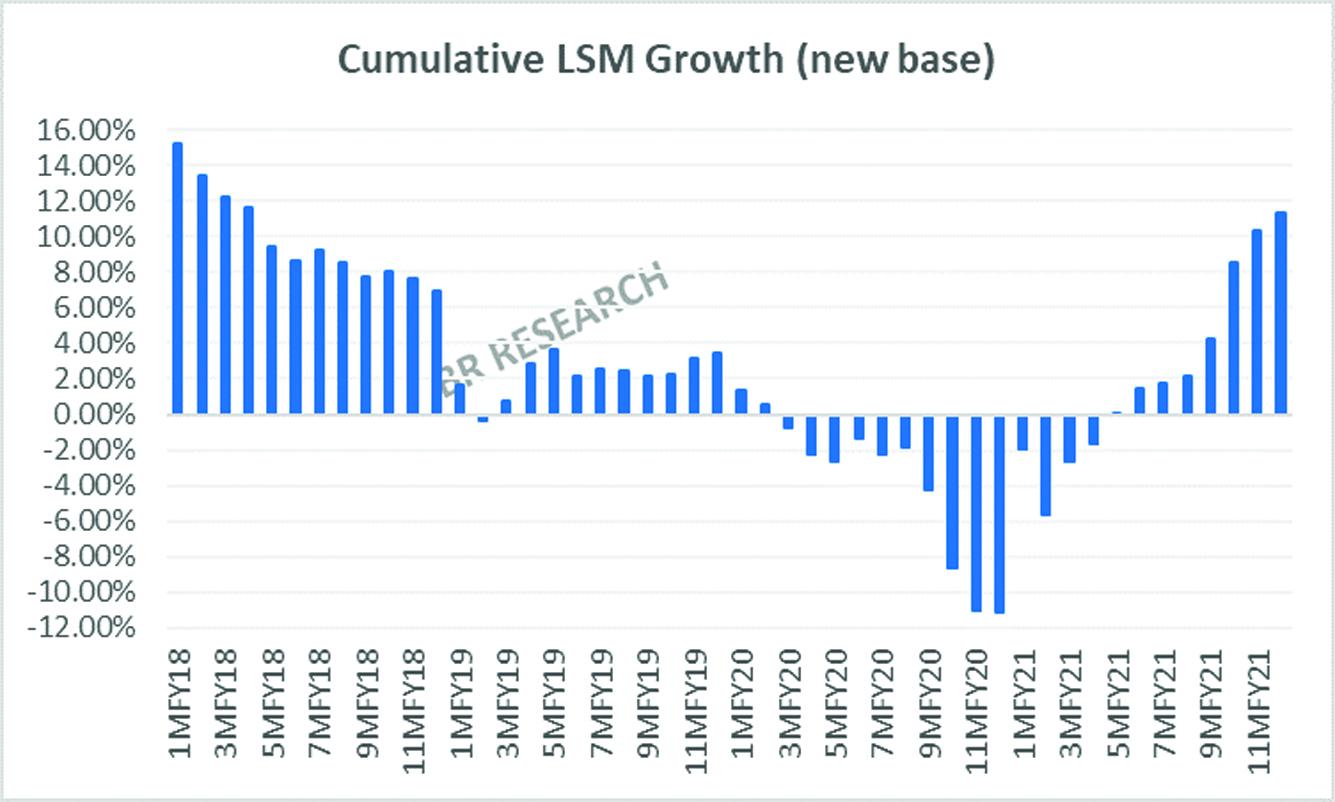
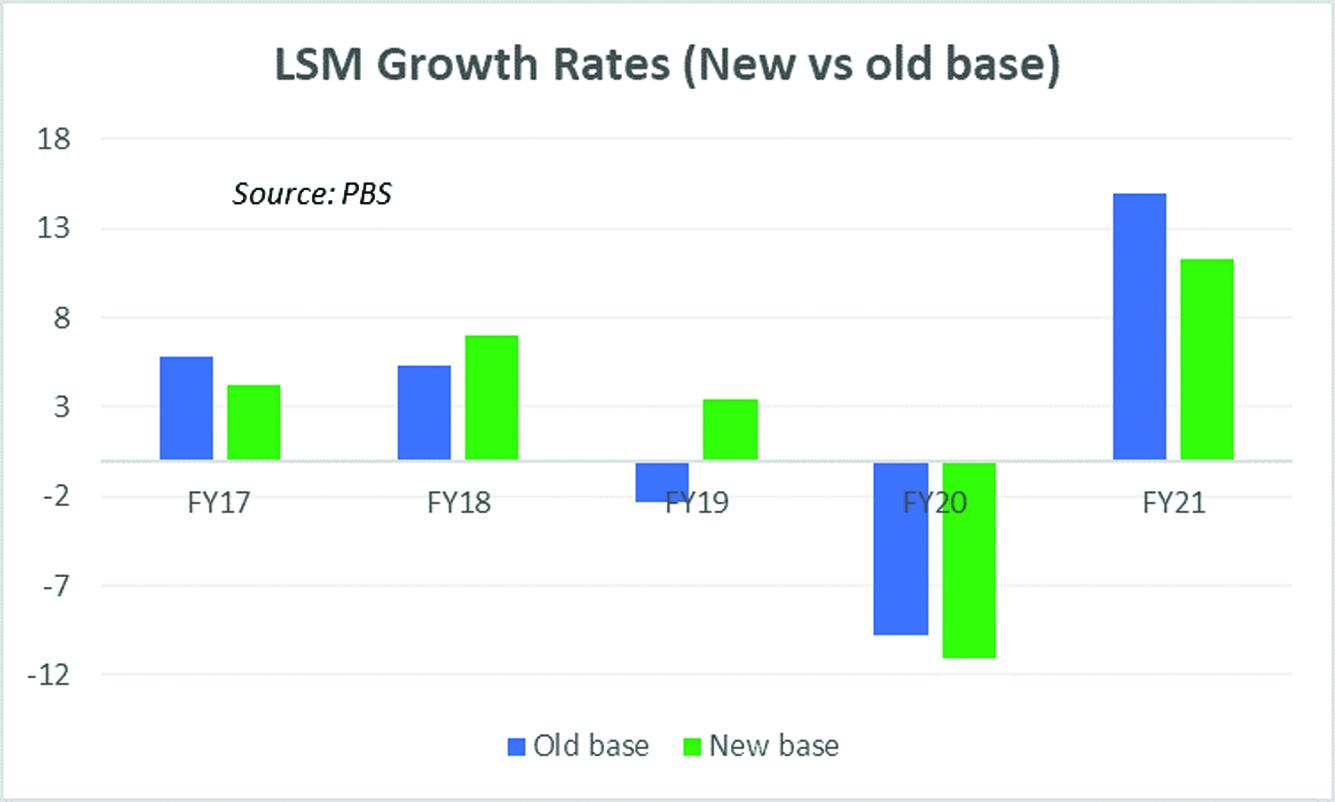
The other notable addition is that of preserved milk and mineral water, the use of which has significantly increased over the last ten years. The new LSM growth rates throw a vastly different picture, with the most recent FY21 LSM growth revised down from 14.9 percent to 11.3 percent. The most surprising bit is the FY19 growth, deviating 570 basis points – from negative 2.3 percent to 3.4 percent in the positive territory.

Historic growth rates of the newly included wearing apparel depict an interesting trajectory. Showing near 40 percent growth in FY19, when LSM growth was the then lowest in over a decade, and then not even recovering to pre-pandemic level in FY21, showing double-digit negative growth. It could well be the composition of the category which only includes one item that could be causing such a swing, as it is hard to fathom how wearing apparel has continued to struggle so bad, that it could not even come back from the depths of Covid. The item-wise LSM quantity details would throw more light on these numbers. All said, the rebased LSM is much-welcome, as it was much-needed.


























Comments
Comments are closed for this article.