

Yesterday, this column discussed the prospects of a National Cotton Policy amid a weak cotton outlook (Read: “Cotton Policy?â€). Looking further at the decreased cotton production, today’s article explores the reduction in the area under cotton, specifically with respect to Punjab.

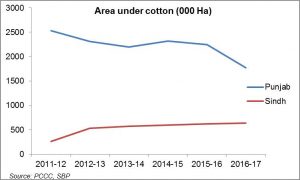
The area under cotton in Punjab has been falling over the years, with the most recent year bringing a precipitous fall of 20 percent. The province has gone from accounting for almost 90 percent of the total area under cotton in 2011 to just 72 percent this year. In terms of production, Punjab accounted for just 65 percent of total cotton this season, as against 82 percent in 2011. Meanwhile, the area under cotton has gradually increased in Sindh, where cotton production has remained steady over the years.
A large part of the missing area in Punjab can be accounted for by sugarcane (for area under sugarcane, read ‘Sugarcane’s popularity,’ published February 09, 2017). As per the SBP’s quarterly report on the economy, the reasons for this shift are “exceptional losses from previous year’s crop (due to pest infestation) and low domestic cotton prices at the sowing time.†Industry sources have also confirmed the sugarcane epidemic, which has been around for a while and not just this year. No surprise, then, that the PCGA is demanding a ban on sugarcane sowing in core-cotton zones.
Chairman PCGA, Dr Jassumal told BR Research that the shift away from cotton has been due to the government protecting and facilitating the sugar industry, giving support price, export subsidy, and import tariffs. He said there is already a ban of sowing sugarcane in cotton zones but it is being violated.
As for Sindh, alternate crops like sugarcane or rice – which are highly water-intensive – are generally uncultivable there. This has automatically preserved the cotton areas there. Districts like Sukkur and Sangarh have emerged as major cotton-growing areas in Sindh. Generally, weather is more favourable in Sindh, where the incidence of Cotton Leaf Curl Virus is also relatively low.
To make matters worse for Punjab, the provincial government earlier this year banned cotton sowing before the 15th of April to avoid pink bollworm. The effect of this, as per various media reports, has been an increasing shift towards other crops, further exacerbating the situation. Is a support price needed to bring Punjab back on track?


Comments
Comments are closed for this article.