 PACE Pakistan Limited (PSX: PACE) was established in 1992 and is a public limited company. It is engaged in the business of acquiring, developing, selling and managing real estate assets such as condominiums, departmental stores, shopping plazas, super markets, utility stores, housing societies, etc.
Its business is essentially categorized into 'Real estate' sales and 'Investment properties'. Since it operates in the service industry, there is no capacity per se as is the case in manufacturing industry.
Shareholding pattern
PACE Pakistan Limited is mostly owned by the local general public- at 63.5 percent. Associated companies, related parties and undertakings own about 15 percent shares in the company. Of this Sisley Group of Company Limited holds the majority of the shares. The directors, CEO, their spouses and minor children hold a very little share in the company.
Historical and operational performance
PACE Pakistan Limited's performance has been fluctuating through the years with margins following a similar trend. However, in the last half of the decade FY18 experienced the highest top-line but this was not reflected in the bottom-line, with net margin declining and operating and gross margins depicting changes only marginally.
 The economy of Pakistan during FY15 exhibited improved performance with inflation recorded at an all-time low- at around 2 percent; agreement with Chinese Government on China Pak Economic Corridor (CPEC); the GDP growth rate also increased from 4.03 in FY14 to 4.24 in FY15. With this backdrop, it comes as no surprise that there was a positive impact on the real estate of the country; the construction sector contributed 2.4 percent to the GDP and provided employment opportunities to about 7 percent of the labour force. The positive impact is evident from the company's sales growing at nearly 14 percent year on year.
 Despite the positive macroeconomic environment, PACE continued its period of losses for the fifth time consecutively in FY15. The cost of sales consumed about 99 percent of the top-line, of which store operating expenses, mainly fuel and power contributed the largest share. Thus, it recorded negative margins for the year.
During FY16, the economy continued its growth momentum, with a real GDP recorded at 4.7 percent. The government's spending on infrastructure and power sector development program under CPEC encouraged construction activity in the economy. The company's top-line increased by almost 26 percent; however, there were sales returns of Rs103 million during the year, due to reversal of sales of commercial floor. Hence, effectively there was only a marginal increase in net sales.
 PACE was able to recover from losses on the back of significant income generated from 'settlement of loans of backs against inventory of the company at market rates' eventually resulting in the company to record a net profit of Rs294 million as compared to a loss of Rs306 million in the preceding year.
 The year 2017 seemed to be a good year for the real estate sector which contributed around 2 percent of the GDP of the country. The year was marked by commencement of work on the $51.5 billion CPEC, the benefits of which were expected to trickle down to the real estate industry.
 Although the top-line of the company grew only marginally by nearly 2 percent, with cost of sales consuming almost 97 percent it, the company was saved from incurring losses due to income generated from secondary sources such as 'gain on loan settlements and gain due to waiver of markup'. In addition, PACE was also able to curtail other expenses which primarily constitute exchange gain/loss on foreign currency convertible bonds.
 According to the company's annual report of FY18, the property market of Pakistan has been following an upward trend. PACE's top-line grew by almost 51 percent year on year at Rs640 million, the highest recorded since FY12 due to an increase in sale of PACE tower. However, this could not be reflected in margins due to cost of sales consuming more than the value of net revenue. Of this a major component was value of purchases of inventory.
In addition, there was a considerable decline in other income as a result of 'substantial amounts of settlements executed during the previous year'. Another factor which contributed to negative margins was exchange loss on foreign currency convertible bonds of Rs278 million, which was absent last year.
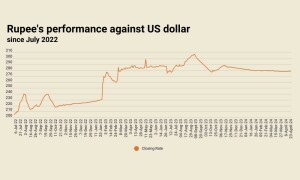
During FY19, the net margin hit an all-time low while the top-line also declined by about 31 percent. The latter was due to the sale of shops in Gujrat, Model Town Extension and MM Alam plazas in the preceding year, which was missing in FY19. While PACE was able to record a positive gross profit of Rs94 million as opposed to a gross loss of Rs8 million, net margins were marred by exchange loss on foreign currency convertible bonds due to devaluation of the Pakistani currency from Rs121.6 in FY18 to Rs164 in FY19, resulting in a net loss of Rs928 million, the highest in the last five years.
Quarterly results and future outlook During 1QFY20, PACE Pakistan Limited was able to increase its top-line year on year in addition to reducing cost of sales, resulting in improved gross margins from 15 percent in 1QFY18 to 39 percent in 1QFY20. Moreover, with the stability in the currency, the exchange loss translated into exchange gain, eventually leading the company to record a positive net profit of Rs99 million for the period as compared to a net loss of Rs79 million in 1QFY19.
The company has been facing liquidity problems since a few years with current liabilities exceeding current assets. The company was unable to cash receivables and repay lenders thus casting doubt on the company's ability to continue as a going concern, as per the company's annual report.
By delivering important development projects such as Pace Towers in FY20, the company hopes to generate cash flows internally by 'converting non-income producing assets to cash flowing operating assets'.
========================================================================
PACE: Pattern of shareholding as at June 30, 2019
========================================================================
Categories of shareholders                                             %
========================================================================
Directors, CEO, their spouses and minor children                       0
Associated companies, undertakings and related parties              15.3
Banks, DFIs, and NBFIs                                              0.45
Insurance companies                                                 0.13
General public:
Local                                                              63.51
Foreign companies/organisations/individuals/ (repatriable bases)   12.44
Others-Joint stock companies                                        8.03
========================================================================
Total                                                                100
========================================================================
Source: Company accounts
===========================================================================================
PACE: Quarterly results
===========================================================================================
Rs (mn)                                                       1QFY20     1QFY19         YoY
===========================================================================================
Sales                                                            141        107      31.78%
Cost of sales                                                   (86)       (91)      -5.49%
Gross profit                                                      55         16     243.75%
Administrative and selling expenses                             (28)       (30)      -6.67%
Other income                                                      11          9      22.22%
Exchange gain/(loss) on foreign currency convertible bond        142       (46)    -408.70%
Profit/(loss) from operations                                    180       (51)    -452.94%
Finance costs                                                   (41)       (27)      51.85%
Profit/(loss) before tax                                         139       (78)    -278.21%
Taxation                                                        (40)        (1)    3900.00%
Profit/(loss) for the year                                        99       (79)    -225.32%
EPS                                                             0.35     (0.29)
===========================================================================================
Source: Company accounts


Comments
Comments are closed.