Pakistan Refinery Limited

Pakistan Refinery Limited (PSX: PRL) was incorporated as a public limited company in 1960. Located on the coastal belt of Karachi, the main processing unit is located at Orange Creek with supporting crude berthing and storage facility at Kenmare. The initial design capacity of the refinery was to process 1 million tons of crude oil annually, which was subsequently expanded to 2.1 million tons per annum. Its current capacity stands at 47,000 barrels per day of crude oil into petroleum products like furnace oil, high speed diesel, kerosene oil, jet fuel and motor gasoline, among others.

Before 2019, majority of PRL's shares were held primarily held by PSO, Shell and Hascol together hold over 70 percent of the shares. However, it FY19, Pakistan State Oil Company Limited (PSO) acquired 84 million shares from Shell Petroleum Company Limited, UK, which increased its shareholding in the Company to 52.68 percent, making PSO the parent company of PRL. The table gives the breakdown of the shareholding

Past performance Refining sector's profitability has been on a roller coaster ride. PRL's profitability has too been up and down in the recent past. A look at the last five years show that PRL's earnings and margins dipped in the negative zone in FY14 as the refining margins for hydro-skimming refineries remained low due to sharp increase in crude oil prices and weak demand for products worldwide.

Though profit margins improved for PRL in FY15, the fiscal year continued to drag the continued to affect the refining segment due to high cost and weak demand, which along with steep decline in crude oil and product prices resulted in heavy inventory losses. PRL saw a 36 percent year-on-year decrease in its top-line along with increased finance cost that resulted in after tax losses. This aggravated the negative equity situation of the firm, which had been an issue for the firm since 2010.

FY15 was a year of up gradation and capex where the board of directors announced a right issue to meet the capex and financial requirements of its projects. It was in FY15 that PRL finally inaugurated its much awaited isomerisation plant that converts low-value naphtha into gasoline (petrol), a premium product, doubling its petrol production. The up gradation boded well on PRL's profitability and the company's earnings turned positive despite a decline in the revenues in FY16. Earnings became positive due to healthy gross refinery margins (GRMs) and the doubling of production of motor gasoline as the new isomerisation plant operated for full year.
Following the right-issue and the firm's commissioning of the isomerisation plant, the liquidity position of the company improved as the bank borrowings reduced. In FY17, PRL saw its net profits improve by more than three times, which also brought some reduction to the negative equity. However, during the year, the refinery faced the deactivation of the catalyst of the isomerisation plant, which reduced the firm's petrol production from 20,000 metric tons to 15,000 metric tons.
The recovery that was seen after FY16 was busted in FY18 as PRL's profit after tax halved despite a healthy growth of 32 percent in the company's revenues. Refining margins remained weak and put pressure on gross profitability.
Also, the catalyst of isomerisation plant that was impaired FY17 could not be operated at full capacity from July to November 2017, which resulted in lower production of petrol by 22,000 metric tons. On the other hand, the company overcame the negative equity situation that it had been facing for long.

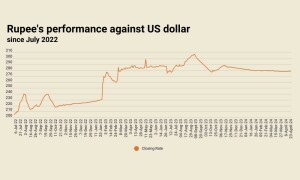
FY18 was marred by increased exchange losses due to currency depreciation and pressure on refinery operation due to decline in furnace oil demand amid its curtailment, which resulted in buildup of stock pile for the refinery.
Financial performance FY19 The ill-fate for the refining segment continued in FY19 - rather worsened as coupled with slowing economy. The company highlights low prices of motor gasoline in the international markets, depressed refining margins and steep devaluation of the currency at home as key factors behind the debilitating in the company's financial performance.
The financial statement shows that PRL's revenue growth was around 25 percent, but the effect of weak refining margins can be seen in more that proportionate increase in cost of sales, resulting in gross loss for the period.
Decline in furnace oil demand led to build-up of furnace oil inventory which in turn put pressure on the refinery operations. Consequently, the company incurred loss for the year amounting to Rs5.82 billion in FY19 as compared to profit of Rs504 million last year.
PRL's liquidity position remained weak as can be seen from increase in short term borrowings due to increased working capital requirements as well as losses incurred by the refinery. And amid high interest rate environment, the company's finance cost jumped by 145 percent year-on-year in FY19.

Outlook A key factor behind weak performance of the refining segment has been the sector's operations on age old technology and inability to up gradate. Time and again, refineries have been urged to speed up their expansion and up gradation projects as furnace oil curtailment continues and higher fuel standards await to be adopted along with high prospects for international competition. Upgrading to Euro II standards for diesel is still waiting to happen for the refineries whereas around the world, the refiners have moved onto Euro IV/V and are contemplating up gradation to Euro VI now. Along with other refineries, PRL too has been unable to complete the up gradation project of installation of Diesel Hydro-desulphurization Unit (DHDS) to produce EURO II compliant diesel.
This has been a key factor for poor performance of the refining sector. Though PRL's financial performance improved in 1QFY20, the turnaround of the firm will depend on expansion and up gradation. Growth in gross margins for PRL in 1QFY20 came from stable currency.
PRL is still better off than other refineries, in that it has PSO's support to fulfill the up gradation projects. It has plans to invest $1 billion in converting its refining facility into a deep conversion refinery that convert furnace oil into petrol and high-speed diesel. This is the only way to go forward as the government has now warned the refineries to upgrade with significant progress in 3 months - or be ready for a shut down.
===========================================================
Pattern of Shareholding-PRL
(As at June 30, 2019)
===========================================================
Shareholder's Category                           Percentage
===========================================================
Directors, Chief Executive Officer, and their
spouse and minor children                             0.01%
Associated companies, undertakings and
related parties
Hascol Petroleum Limited                              14.7%
Pakistan State Oil Company Limited                    52.7%
Banks, Development Financial Institutions,
Non-Banking Financial Institutions                    0.09%
Insurance Companies                                   1.51%
Modarabas and Mutual Funds                            2.03%
General Public:
(a)Foreign                                            0.00%
(b)Local                                             21.64%
Others
(a)Foreign                                            4.46%
(b)Local                                              2.85%
===========================================================
Total                                                  100%
===========================================================
Source: Company accounts
==========================================================================================
Pakistan Refinery Limited (PRL): Financial Ratios
==========================================================================================
                                         FY14     FY15     FY16     FY17     FY18     FY19
==========================================================================================
Gross margin                  %         -0.50    -0.74     3.07     3.68    1.113   (2.74)
Net margin                    %        (0.61)   (1.30)     0.44     1.51     0.55   (5.03)
EEITDA margin                 %        (0.05)   (0.67)     3.43     4.13     2.42   (2.51)
CFO to sales                  %           242    -0.06    -1.66     6.22    -0.49   (5.80)
Debtor turnover               Times     17.69     15.9    18.37    21.26    21.95    14.97
Creditor turnover             Times      7.79     5.07     5.33     7.98     9.70    10.95
Inventory turn over           Times     13.83    12.09    11.83     11.3    12.73    13.77
Total assets turnover ratio   Times      4.93     2.96     2.61      2.7     3.02     2.70
Fixed assets turnover ratio   Times     19.19     7.52     5.35     5.71     6.86     6.10
[Loss) 1 Earning per share    Rs       (3.96)   (5.42)     0.93     3.45     1.64  (18.92)
Cash dividend per share       Rs            0        0     0.31        0        0        0
Interest cover ratio          Times    (0.47)   (1.27)     1.56     3.57     2.52   (2.63)
Current ratio                 Ratio    0.76:1   0.67:1   0.60:1   0.65:1   0.79:1   0.69:1
Quick ratio/acid test ratio   Ratio    0.39:1   0.34:1   0.30:1   0.30:1   0.40:1   0.41:1
==========================================================================================
Source: Company accounts
=============================================================
Pakistan Refinery Limited
=============================================================
Rs (mn)                        1QFY20      1QFY19         YoY
=============================================================
Net sales                      35,721      25,510         40%
Cost of sales                  34,719      25,466         36%
Gross profit                    1,002          44       2178%
Distribution cost                  67          57         17%
Administrative exp                 90          86          4%
Other operating exp                35           1       4910%
Other income                       97          42        130%
Operating loss                    908      (57.4)
Finance cost                      454         229         98%
Share of income of associa          -           2       -100%
Profit after taxation             181       (420)
Earnings per share (Rs)          0.59      (1.37)
Gross margin                    2.81%       0.17%
Operating margin                2.54%      -0.22%
Net margin                      0.51%      -1 65%
=============================================================
Source: PSX


Comments
Comments are closed.