


Cnergyico Pakistan Limited (PSX: CNERGY) was incorporated in Pakistan as a public limited company in 1995. The company is engaged in oil refinery business and petroleum marketing business with the latter being launched in 2007. CNERGY was previously known as Byco Petroluem Pakistan Limited.
Pattern of Shareholding
As of June 30, 2025, CNERGY has a total of 5493.448 million shares outstanding which are held by 23,892 shareholders. Associated companies, undertakings and related parties have the majority stake of 76.61 percent in the company followed by local general public holding 14.83 percent shares. Around 1.56 percent of CNERGY’s shares are held by Banks, DFIs and NBFIs and 1.16 percent by Modarabas & Mutual funds. The remaining ownership is distributed among other categories of shareholders.
Historical Performance (2019-25)
CNERGY’s topline slid twice during the period under consideration i.e. in 2020 and 2021. Its bottomline entered negative zone in 2019. In 2020, net loss further mounted. This was followed by two successive years where CNERGY posted a positive bottomline. In 2023, the company registered the highest ever net loss. 2023 was also the year where the company also recorded gross and operating losses unlike other years under consideration. In 2024, the company posted net profit.
However, it was followed by a net loss in 2025. The company’s margins which drastically fell in 2019 showed upturn in the subsequent years to reach their optimum level in 2022. The margins fell into the negative territory in 2023. In 2024, CNERGY’s margins considerably recovered. In 2025, the margins deteriorated yet again (see the graph of profitability ratios). The detailed performance review of the period under consideration is given below.
In 2019, CNERGY’s topline grew by 18.97 percent year-on-year to clock in at Rs.197,830.72 million. This was merely the result of upward revision in oil prices as well as the effect of currency depreciation. During the year, the company’s production slid by 8.7 percent year-on-year to clock in at 18.39 million barrels. This resulted in 33 percent capacity utilization in 2019 as against 36 percent capacity utilization recorded in 2018. In 2019, the company faced multiple challenges.
Firstly, the demand of furnace oil (FO) drastically declined as FO was increasingly being replaced by LNG and coal for power generation. Secondly, there were abrupt changes in the international oil prices in 2019 with motor gasoline trading far below crude oil which further squeezed the industry’s margins. Pak Rupee depreciation added to ado.
This resulted in 78.60 percent year-on-year slump in CNERGY’s gross profit with GP margin falling down from 5.51 percent in 2018 to 0.99 percent in 2019. Administrative expense surged by 9.17 percent year-on-year in 2019 mainly on account of SAP maintenance charges, repair & maintenance charges, travelling & conveyance expense as well as utilities expense incurred during the year. Selling & distribution expense also escalated by 22.82 percent in 2019 due to higher salaries of sales force and greater depreciation charges.
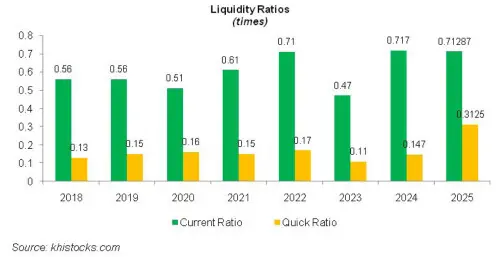
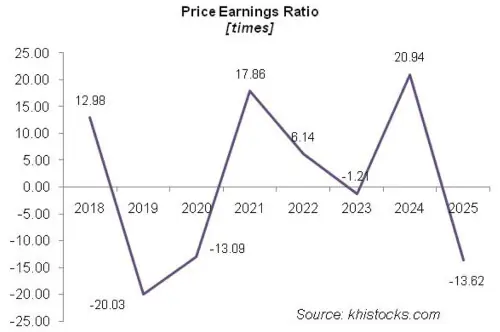
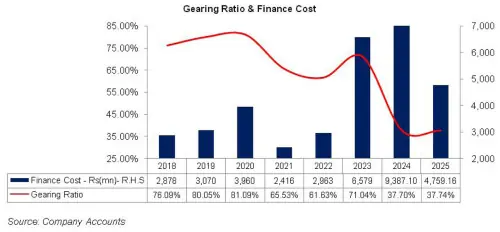
CNERGY was able to cut down its other expense by 44.45 percent year-on-year in 2019 primarily by keeping a check on its late payment surcharge & penalties and also by booking lesser provision for doubtful debts. Other income also shrank by 38.70 percent in 2019 due to high-base effect as the company wrote back liabilities in the previous year. Operating profit registered a steep 89.91 percent decline in 2019 with OP margin falling down from 4.96 percent in 2018 to 0.42 percent in 2019. Finance cost inched up by 6.65 percent in 2019 on account of higher discount rate and increase in the company’s borrowings particularly finance against trust receipts for import and procurement of crude oil and petroleum products. Increased borrowing is also evident in the company’s gearing ratio (see the graph of gearing ratio & finance cost). CNERGY registered net loss of Rs.1683.70 million in 2019 as against net profit of Rs.5019.83 million posted in 2018. Loss per share stood at Rs.0.32 in 2019 versus EPS of Rs.0.94 posted in 2018.
In 2020, CNERGY’s topline slipped by 12.10 percent year-on-year to clock in at Rs.173,898.93 million. The company’s production further eroded by 5.2 percent year-on-year in 2020 to clock in at 17.43 million barrels with capacity utilization of 31 percent. While there was lower consumption of FO for power generation in Pakistan which had taken its toll on the refineries’ margins, in 2020, International Maritime organization (IMO) put restriction on the usage of FO as bunker fuel, resulting in the dive in prices from November 2019 to March 2020. As the prices started stabilizing, COVID-19 hit the world economies which took heavy toll on the demand of oil products resulting in a freefall in prices.
For the first time in the history, oil prices were quoted in negative. Reduced prices of oil in the international market coupled with the company’s proactive strategy of rationalization of crude cargos and change in cargo pricing in anticipation of price movement resulted in 47.79 percent improved gross profit posted by CNERGY in 2020 with GP margin rising up to 1.67 percent. Administrative and selling expense posted an increase of 2.83 percent and 16.13 percent respectively in 2020 mainly on the back of higher payroll expense and depreciation.
Higher provision for doubtful debt resulted in 65.83 percent inclination in other expense in 2020. However, it was offset by 34.78 percent rise in other income mainly as the company recognized higher interest on balances due from customers as well as higher scrap sales during the year. Operating profit rebounded by 83.89 percent in 2020 with OP margin mounting to 0.88 percent. Finance cost multiplied by 29 percent in 2020 due to higher discount rate for most part of the year as well as increased short-term borrowings which further drove up its gearing ratio. CNERGY’s net loss magnified by 44.37 percent in 2020 to clock in at Rs.2430.799 million with loss per share of Rs.0.46.
CNERGY’s net sales continued to decline in 2021 to the tune of 18.26 percent to clock in at Rs.142,150.30 million. The actual throughput for the year was 14.2 percent lesser than last year with capacity utilization standing at 26 percent. As business activity began to resume, the demand began to gain momentum. CNERGY had already setup a fluid catalytic cracking unit (FCC) to convert FO into Motor Spirit (MS) and High Speed Diesel (HSD).
This bore fruit and the demand of MS and HSD significantly improved in 2021. 179.94 percent higher gross profit recorded by the company in 2021 was the result of better inventory management. GP margin also rose up to 5.70 percent in 2021. This was also because GoP revised the pricing formula for MS and HSD and started computing their prices on bi-monthly basis. OMC’s margin on MS and HSD also increased from Rs.2.81 per liter to Rs.2.97 per liter.
Administrative expense rose by 7.57 percent in 2021 as the number of employees increased from 867 in 2020 to 911 in 2021 which increased the payroll expense. Conversely, distribution expense tumbled by 0.32 percent in 2021 which was the effect of lower rent, rates and taxes incurred.
Higher provisioning for doubtful debts resulted in other expense escalating by 22.12 percent in 2021. Other income eroded by 8.38 percent in 2021 due to lower interest income on account of monetary easing.
Operating profit mounted by 310.98 percent in 2021 with OP margin reaching 4.42 percent. Finance cost dropped by 38.99 percent in 2021 on account of low discount rate and lesser short-term borrowings obtained during the year. CNERGY was able to record net profit of Rs.3,595.84 million in 2021 with EPS of Rs.0.65. NP margin stood at 2.53 percent in 2021.
After two successive years of topline slide, CNERGY’s topline recorded 19.6 percent rebound to clock in at Rs.170,015.07 million in 2022. Production volume drastically fell by 37.8 percent in 2022 with capacity utilization clocking in at 16 percent. During the 2HFY22, the refining industry made immense profits due to Russia-Ukraine crisis which drove up the crack spreads to an unparalleled level. International oil prices surged beyond $100 per barrel. However, due to steep depreciation of Pak Rupee and current account woes, the local oil industry was facing difficulty in getting Letter of Credit which restricted its performance. Nevertheless, gross profit grew by 35.32 percent in 2022 with GP margin touching its optimum level of 6.45 percent. Administrative and selling expense surged by 10.15 percent and 2.86 percent respectively in 2022 which was mainly on account of higher payroll expense.
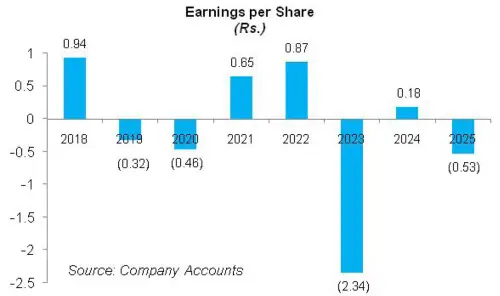
This was despite the fact that CNERGY streamlined its workforce to 895 employees in 2022. No late payment surcharge and penalties incurred during the year which coupled with lesser allowance for doubtful debt allowed the company to cut back its other expense by 5.88 percent in 2022. Other income shrank by 18.75 percent in 2022 due to lower scrap sales and no reversal of WWF unlike last year. Operating profit revived by 41.32 percent in 2022 with OP margin reaching 5.23 percent. Finance cost spiraled by 22.61 percent in 2022 due to higher discount rate. Net profit enlarged by 33.15 percent in 2022 to clock in at Rs.4787.876 million with EPS of Rs.0.87 and NP margin of 2.82 percent.
In 2023, CNERGY’s topline grew by 14.06 percent year-on-year to clock in at Rs.193,912.16 million. The company’s throughput diminished by 26.7 percent in 2023 with capacity utilization clocking in at its lowest level of 12 percent. This was due to sluggish economic activity in the country due to which oil consumption fell by 26 percent in 2023.
Furthermore, on account of dwindling foreign exchange reserves, oil companies were not allowed to obtain forward cover for their payments. Obtaining Letters of Credit even at exorbitant rates was not allowed to oil companies, resulting in under utilization of their available plant capacity. Oil prices in the international market crossed $110 per barrel during the year but dropped thereafter. However, Pak Rupee depreciation didn’t allow the local companies to take optimum advantage of plunge in oil prices.
The devastating floods in the 1HFY23 destroyed the country’s infrastructure and affected the transportation of the company’s products during the year. All these factors culminated into gross loss of Rs.9749.26 million recorded by CNERGY in 2023. Administrative expense soared by 12.55 percent in 2023 due to significant rise in payroll expense despite the fact that the number of employees was reduced to 725 in 2023 from 895 in 2022.
Lower depreciation on right-of-use assets resulted in 18.84 percent reduction in selling & distribution expense in 2023. Other expense mounted by 51.97 percent in 2023 on the back of higher provisioning for ECL. CNERGY wrote back liabilities worth Rs.6081.235 million in 2023 which drove up its other income by 681.73 percent in 2023.
This not only absorbed the company’s operating expense but also greatly reduced the magnitude of operating loss incurred by the company in 2023. CNERGY registered operating loss worth Rs.5635.29 million in 2023. The company’s performance was further exacerbated by 122.06 percent hike in the company’s finance cost in 2023 which was the effect of higher discount rate. CNERGY recorded net loss of Rs.12,663.279 million in 2023 with loss per share of Rs.2.34.
In 2024, CNERGY’s topline grew by 24.09 percent to clock in at Rs.240,626.17 million. This was due to 32.50 percent higher refining throughput recorded during the year. This, coupled with the increase in the retail prices of POL products for most part of the year and change in the oil procurement strategy (tapping new crude oil suppliers and reaching better terms with the existing suppliers) enabled the company to record gross profit of Rs.12430.15 million in 2024 with GP margin clocking in at 5.17 percent.
A surge of 32 percent in selling expenses in 2024 is due to higher salaries of sales force and higher depreciation on right-of-use assets. Administrative expense mounted by 24 percent in 2024 due to higher payroll expense, repair & maintenance charges as well as SAP and other software maintenance charges incurred during the year. CNERGY expanded its workforce from 725 employees in 2023 to 744 employees in 2024. Other expense declined by 75.98 percent in 2024 due to high-base effect as the company booked hefty provisioning for ECL in the previous year.
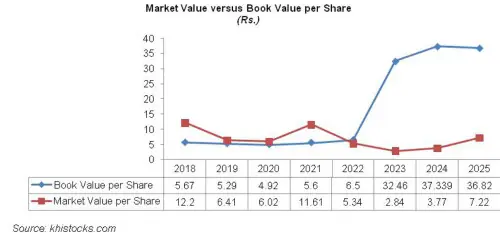
Other income also dropped by 85.77 percent in 2024 which also appears to be the effect of high-base as the company recorded gain on the modification of its liability in the previous year. In 2023, Castockco PK (Private) Limted (formerly Integrate Pk (Private) Limited) waived off portion of its loan amounting to Rs. 4,591.531 million through waiver agreement and created a new liability with revised fair value.
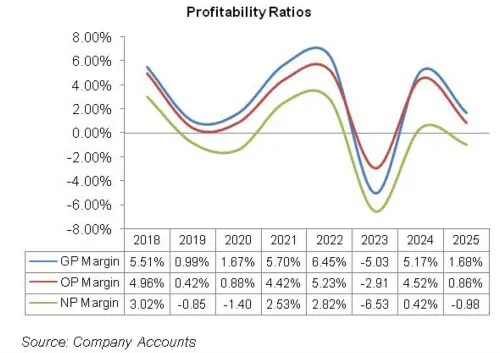
CNERGY posted operating profit of Rs.10872.13 million in 2024 as against operating loss of Rs.5635.29 million posted in 2023. Finance cost mounted by 42.69 percent in 2024 due to high discount. CNERGY registered net profit of Rs.1008.374 million in 2024 with EPS of Rs.0.18 and NP margin of 0.42 percent.
In 2025, CNERGY recorded 23.31 percent year-on-year growth in its topline which clocked in at Rs.296,719.74 million. The international oil prices kept fluctuating throughout the year resulting in reduced crack spreads. Moreover, unmonitored smuggling of petroleum products resulted in inventory stockpiles which had to be exported at loss. This also resulted in reduced capacity utilization and lower absorption of fixed cost. The imposition of global tariffs during the year also resulted in sharp decline in oil prices resulting in hefty inventory losses. Moreover, according to Finance act 2024, effective from July 01, 2024, petroleum products are no longer treated as taxable supplies for sales tax and rather as exempt supplies. This has increased their running cost as they can’t claim the input tax they pay on their purchases. All these factors resulted in 59.78 percent deterioration in CNERGY’s gross profit in 2025 with GP margin falling down to 1.68 percent.
Administrative expense surged by 11 percent in 2025 due to higher payroll expense, maintenance & repair charges as well as SAP & other software maintenance charges incurred during the year. Selling & distribution expense also mounted by 9.56 percent in 2025 apparently due to higher salaries of sales force, advertisement expense and depreciation on operating fixed assets. Other expense stayed largely intact during the year. Conversely, other income dwindled by 57.89 percent in 2025 due to lower income from banking deposits and no scrap sales recorded during the year. CNERGY recorded 76.54 percent decline in its operating profit in 2025 with OP margin drastically falling down to 0.86 percent. Finance cost tapered off by 49.30 percent in 2025 due to monetary easing. The company recorded net loss of Rs.2895.42 million in 2025. This translated into loss per share of Rs.0.53 in 2025.
Recent Performance (9MFY26)
During the first half of the ongoing fiscal year, CNERGY posted a robust 20 percent year-on-year growth in its net sales which clocked in at Rs.261,855.87 million. During the period under consideration, crude oil prices saw severe volatility on account of geopolitical tensions in the Middle Eastern region and the blockage of the Strait of Hormuz from where 80 percent of the Pakistan’s oil imports are routed. Pakistan energy market uses Dubai crude as a benchmark rate which surpassed USD 160 per barrel due to supply shock. However, since CNERGY sources its supplies from the US and Africa, it stayed resilient in the midst of the supply volatility. Moreover, the prices of refined petroleum increased much more than the crude oil, resulting in hefty crack spreads. Besides, the crude oil sourced from the US and Africa is lighter and sweeter which allowed the company to cut down its processing charges. Increased refinery throughput of 5 billion barrels also reduced the fixed cost per barrel. CNERGY utilizes single point mooring (SPM) which enabled it to import larger cargoes and reduce the freight cost per barrel. All these factors translated into a massive 461.19 percent improvement in CNERGY’s gross profit with GP margin clocking in at 10.65 percent versus GP margin of 2.27 percent recorded during 9MFY26. Administrative and selling expense hiked by 8.91 percent and 11.58 percent respectively during 9MFY26 due to enhanced refinery operations during the period which pushed up the payroll expense, SAP & other software maintenance charges. Other income deteriorated by 55.20 percent during 9MFY26 possibly on account of monetary easing. CNERGY was able to record operating profit of Rs.26,062.27 million in 9MFY26, up 728.91 percent year-on-year. OP margin stood at 9.95 percent in 9MFY26 versus 1.44 percent in 9MFY25. Monetary easing and lesser outstanding short-term borrowings at the end of 9MFY26 allowed the company to squeeze its finance cost by 31.96 percent in 9MFY26. CNERGY posted profit before tax of Rs.23,510.78 million in 9MFY26 versus loss before taxation of Rs.605.93 recorded in 9MFY25. The imposition of super tax resulted in net profit of Rs.17,707,986 million in 9MFY26 versus net loss of Rs.1110.546 million in 9MFY25. CNERGY registered EPS of Rs.3.22 in 9MFY26 versus loss per share of Rs.0.20 recorded in 9MFY25.
Future Outlook
The company’s increasing focus on High Speed Diesel (HSD) and Premier Motor Gasoline (PMG) and the initiation of Very Low Sulphur Fuel Oil (VLSFO) for marine bunkering operations will also aid its sales volume and margins and add diversity to its product mix. However, for this optimistic forecast to materialize, the government needs to curb the crucial issue of petroleum smuggling across the Iranian border. This will not only be beneficial for the oil companies but will also help the government to meet its targeted revenue from petroleum levy.
In Mid-March, the Government of Pakistan introduced Price Differential Claim (PDC) mechanism as a temporary fiscal measure to shield the customers from sharp spike in the international petroleum prices. However, partial reimbursement of the PDC claims from the government remains outstanding, putting pressure of the refineries’ cash-flows. Another distressing factor for the refining industry is the settlement of oil imports at the open market rates which are Rs.2 to 3 higher than the SBP’s weighted average exchange rate used in the petroleum pricing formula.
Going forward, prolonged period of supply chain disruption and regional stress can dent the profitability of the company which will be evident in the year-end financial performance.


Comments